Analysis and Interpretation of Profitability Balance sheets and income statements for 3M Company follow. Consolidated Statements...
Analysis and Interpretation of Profitability
Balance sheets and income statements for 3M Company follow.
| Consolidated Statements of Income | |||
|---|---|---|---|
| Years ended December 31 ($ millions) | 2010 | 2009 | 2008 |
| Net sales | $26,662 | $23,123 | $25,269 |
| Operating expenses | |||
| Cost of sales | 13,831 | 12,109 | 13,379 |
| Selling, general and administrative expenses | 5,479 | 4,907 | 5,245 |
| Research, development and related expenses | 1,434 | 1,293 | 1,404 |
| Loss/(gain) from sale of business | -- | -- | 23 |
| Total operating expenses | 20,744 | 18,309 | 20,051 |
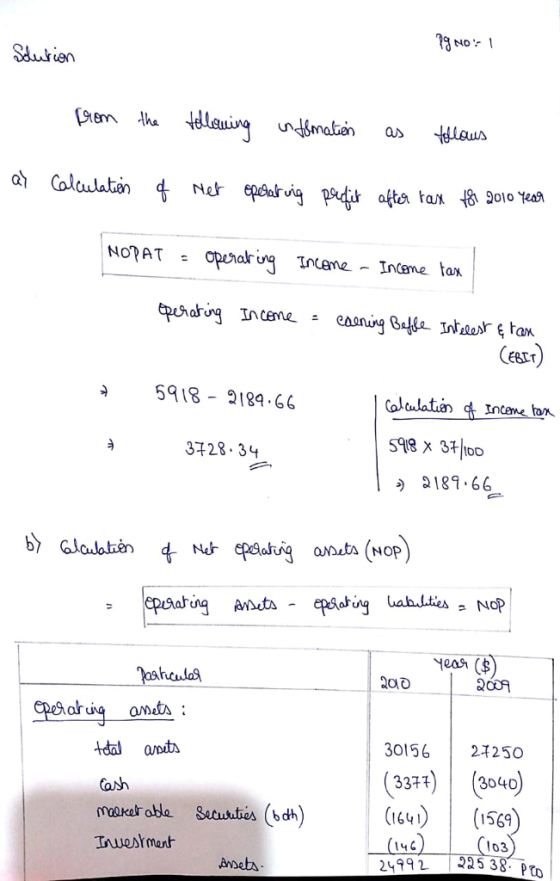
| Operating income | 5,918 | 4,814 | 5,218 |
| Interest expenses and income | |||
| Interest expense | 201 | 219 | 215 |
| Interest income | (38) | (37) | (105) |
| Total interest expense | 163 | 182 | 110 |
| Income before income taxes | 5,755 | 4,632 | 5,108 |
| Provision for income taxes | 1,592 | 1,388 | 1,588 |
| Net income including noncontrolling interest | 4,163 | 3,244 | 3,520 |
| Less: Net income attributable to noncontrolling interest | 78 | 51 | 60 |
| Net income | $ 4,085 | $ 3,193 | $ 3,460 |
| Consolidated Balance Sheets | ||
|---|---|---|
| ($ millions) | 2010 | 2009 |
| Assets | ||
| Current Assets | ||
| Cash and cash equivalents | $ 3,377 | $ 3,040 |
| Marketable securities-current | 1,101 | 744 |
| Accounts receivable-net | 3,615 | 3,250 |
| Inventories | ||
| Finished goods | 1,476 | 1,255 |
| Work in process | 950 | 815 |
| Raw materials and supplies | 729 | 569 |
| Total inventories | 3,155 | 2,639 |
| Other current assets | 967 | 1,122 |
| Total current assets | 12,215 | 10,795 |
| Marketable securities-noncurrent | 540 | 825 |
| Investments | 146 | 103 |
| Property, plant and equipment | 20,253 | 19,440 |
| Less: Accumulated depreciation | (12,974) | (12,440) |
| Property, plant and equipment-net | 7,279 | 7,000 |
| Goodwill | 6,820 | 5,832 |
| Intangible assets-net | 1,820 | 1,342 |
| Prepaid pension benefits | 74 | 78 |
| Other assets | 1,262 | 1,275 |
| Total assets | $ 30,156 | $ 27,250 |
| Liabilities | ||
| Current liabilities | ||
| Short-term borrowings and current portion of long-term debt | $ 1,269 | $ 613 |
| Accounts payable | 1,662 | 1,453 |
| Accrued payroll | 778 | 680 |
| Accrued income taxes | 358 | 252 |
| Other current liabilities | 2,022 | 1,899 |
| Total current liabilities | 6,089 | 4,897 |
| Long-term debt | 4,183 | 5,097 |
| Pension and postretirement benefits | 2,013 | 2,227 |
| Other liabilities | 1,854 | 1,727 |
| Total liabilities | 14,139 | 13,948 |
| Equity | ||
| 3M Company shareholders' equity: Common stock, par value $.01 per share; | 9 | 9 |
| Additional paid-in capital | 3,468 | 3,153 |
| Retained earnings | 25,995 | 23,753 |
| Treasury stock | (10,266) | (10,397) |
| Accumulated other comprehensive income (loss) | (3,543) | (3,754) |
| Total 3M Company shareholders' equity | 15,663 | 12,764 |
| Noncontrolling interest | 354 | 538 |
| Total equity | 16,017 | 13,302 |
| Total liabilities and equity | $ 30,156 | $ 27,250 |
(a) Compute net operating profit after tax (NOPAT) for 2010. Assume
that the combined federal and statutory rate is: 37.0% (Round your
answer to the nearest whole number.)
2010 NOPAT =Answer ?($ millions)
(b) Compute net operating assets (NOA) for 2010 and 2009. Treat
noncurrent Investments as a nonoperating item.
2010 NOA =Answer ? ($ millions)
2009 NOA =Answer ? ($ millions)
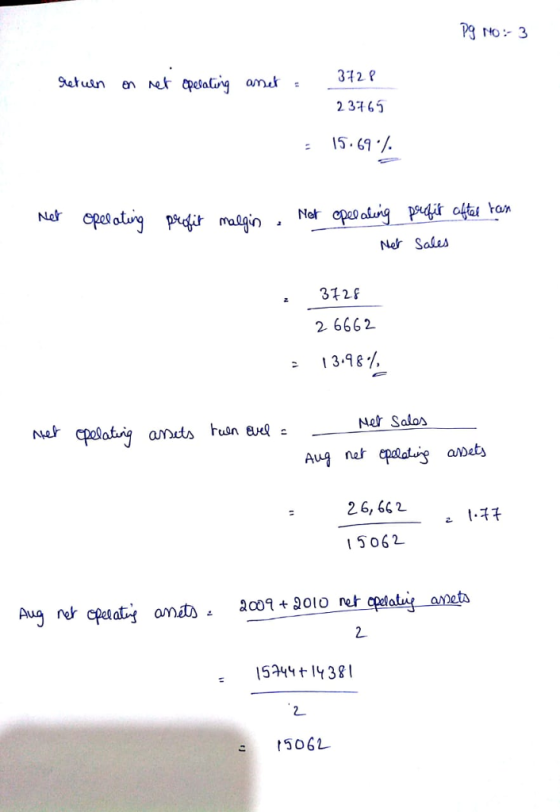
(c) Compute 3M's RNOA, net operating profit margin (NOPM) and net
operating asset turnover (NOAT) for 2010. (Round your answers to
two decimal places. Do not round until your final answer. Do not
use NOPM x NOAT to calculate RNOA.)
2010 RNOA =Answer ? %
2010 NOPM =Answer? %
2010 NOAT =Answer? %
(d) Compute net nonoperating obligations (NNO) for 2010 and
2009.
2010 NNO =Answer? ($ millions)
2009 NNO =Answer? ($ millions)
(e) Compute return on equity (ROE) for 2010. (Round your answers to
two decimal places. Do not round until your final answer.)
2010 ROE =Answer ? %
(f) What is the nonoperating return component of ROE for 2010?
(Round your answers to two decimal places.)
2010 nonoperating return =Answer ? %
(g) Which of the following statements reflects the best inference
we can draw from the difference between 3M's ROE and RNOA?
ROE > RNOA implies that 3M has taken on too much financial leverage.
ROE > RNOA implies that 3M is able to borrow money to fund operating assets that yield a return greater than its cost of debt.
ROE > RNOA implies that 3M's equity has grown faster than its NOA.
ROE > RNOA implies that 3M has increased its financial leverage during the period.
Homework Answers


Add Answer to:
Analysis and Interpretation of Profitability
Balance sheets and income statements for 3M Company follow.
Consolidated Statements...
Analysis and Interpretation of Profitability Balance sheets and income statements for 3M Company follow. Consolidated Statements...
Analysis and Interpretation of Profitability Balance sheets and income statements for 3M Company follow. Consolidated Statements of Income Years ended December 31 ($ millions) 2010 2009 2008 Net sales $26,662 $23,123 $25,269 Operating expenses Cost of sales 13,831 12,109 13,379 Selling, general and administrative expenses 5,479 4,907 5,245 Research, development and related expenses 1,434 1,293 1,404 Loss/(gain) from sale of business -- -- 23 Total operating expenses 20,744 18,309 20,051 Operating income 5,918 4,814 5,218 Interest expenses and income Interest...
Analysis and Interpretation of Profitability Balance sheets and income statements for 3M Company follow. Consolidated Statements...
Analysis and Interpretation of Profitability Balance sheets and income statements for 3M Company follow. Consolidated Statements of Income Years ended December 31 ($ millions) 2012 2011 2010 Net sales $29,904 $ 29,611 $ 226,662 Operating expenses Cost of sales 15,685 15,693 13,831 Selling, general and administrative expenses 6,102 6,170 5,479 Research, development and related expenses 1,634 1,570 1,434 -- -- -- Total operating expenses 23,421 23,433 20,744 Operating income 6,483 6,178 5,918 Interest expenses and income Interest expense 171 186...
Analysis and Interpretation of Profitability Balance sheets and income statements for 3M Company follow. Consolidated Statements...
Analysis and Interpretation of Profitability Balance sheets and income statements for 3M Company follow. Consolidated Statements of Income Years ended December 31 ($ millions) 2007 2006 2005 Net sales $24,462 $22,923 $21,167 Operating expenses Cost of sales 12,735 11,713 10,408 Selling, general and administrative expenses 5,015 5,066 4,631 Research, development and related expenses 1,368 1,522 1,274 Loss/(gain) from sale of business (849) (1,074) -- Total operating expenses 18,269 17,227 16,313 Operating income 6,193 5,696 4,854 Interest expenses and income Interest...
Analysis and Interpretation of Profitability Balance sheets and income statements for 3M Company follow. Consolidated Statements...
 Analysis and Interpretation of Profitability Balance sheets and income statements for 3M Company follow. Consolidated Statements of Income Years ended December 31 ($ millions), 2007 2006 2005 Net sales $24,462 $22,923 $21,167 Operating expenses Cost of sales 12,735 11,713 10,408 Selling, general and administrative expenses 5,015 5,066 4,631 Research, development and related expenses 1,368 1,522 1,274 Loss/(gain) from sale of business (849) (1,074) Total operating expenses 18,269 17,227 16,313 Operating income 6,193 5,696 4,854 Interest expenses and income Interest expense...
Analysis and Interpretation of Profitability Balance sheets and income statements for 3M Company follow. Consolidated Statements...
 Analysis and Interpretation of Profitability Balance sheets and income statements for 3M Company follow. Consolidated Statements of Income Years ended December 31 ($ millions) 2007 2006 2005 Net sales $24,462 $22,923 $21,167 Operating expenses Cost of sales 12,735 11,713 10,408 Selling, general and administrative expenses 5,015 5,066 4,631 Research, development and related expenses 1,368 1,522 1,274 Loss/(gain) from sale of business (849) (1,074) Total operating expenses 18,269 17.227 16,313 Operating income 6,193 5,696 4,854 Interest expenses and income Interest expense...
Analysis and Interpretation of Profitability Balance sheets and income statements for 3M Company follow. Consolidated Statements...
Analysis and Interpretation of Profitability Balance sheets and income statements for 3M Company follow. Consolidated Statements of Income Years ended December 31 ($ millions) 2009 2008 2007 Net sales $23,123 $25,269 $24,462 Operating expenses Cost of sales 12,109 13,379 12,735 Selling, general and administrative expenses 4,907 5,245 5,015 Research, development and related expenses 1,293 1,404 1,368 Loss/(gain) from sale of business -- 23 (849) Total operating expenses 18,309 20,051 18,269 Operating income 4,814 5,218 6,193 Interest expenses and income Interest...
Analysis and Interpretation of Profitability Balance sheets and income statements for 3M Company follow. 3M COMPANY...
 Analysis and Interpretation of Profitability Balance sheets and income statements for 3M Company follow. 3M COMPANY Consolidated Statements of Income For Years ended December 31 ($ millions) 2015 2014 2013 Net sales $30,274 $31,821 $30,871 Operating expenses Cost of sales 15,383 16,447 16,106 Selling, general and administrative expenses 6,182 6,469 6,384 Research, development and related expenses 1,763 1,770 1,715 Total operating expenses 23,328 24,686 24,205 Operating income 6,946 7,135 6,666 Interest expenses and income Interest expense 149 142 145 Interest...
 Analysis and Interpretation of Profitability Balance sheets and income statements for 3M Company follow. Consolidated Statements of Income Years ended December 31 ($ millions), 2007 2006 2005 Net sales $24,462 $22,923 $21,167 Operating expenses Cost of sales 12,735 11,713 10,408 Selling, general and administrative expenses 5,015 5,066 4,631 Research, development and related expenses 1,368 1,522 1,274 Loss/(gain) from sale of business (849) (1,074) Total operating expenses 18,269 17,227 16,313 Operating income 6,193 5,696 4,854 Interest expenses and income Interest expense...
 Analysis and Interpretation of Profitability Balance sheets and income statements for 3M Company follow. Consolidated Statements of Income Years ended December 31 ($ millions) 2007 2006 2005 Net sales $24,462 $22,923 $21,167 Operating expenses Cost of sales 12,735 11,713 10,408 Selling, general and administrative expenses 5,015 5,066 4,631 Research, development and related expenses 1,368 1,522 1,274 Loss/(gain) from sale of business (849) (1,074) Total operating expenses 18,269 17.227 16,313 Operating income 6,193 5,696 4,854 Interest expenses and income Interest expense...
 Analysis and Interpretation of Profitability Balance sheets and income statements for 3M Company follow. 3M COMPANY Consolidated Statements of Income For Years ended December 31 ($ millions) 2015 2014 2013 Net sales $30,274 $31,821 $30,871 Operating expenses Cost of sales 15,383 16,447 16,106 Selling, general and administrative expenses 6,182 6,469 6,384 Research, development and related expenses 1,763 1,770 1,715 Total operating expenses 23,328 24,686 24,205 Operating income 6,946 7,135 6,666 Interest expenses and income Interest expense 149 142 145 Interest...
Most questions answered within 3 hours.
-
Please use python to explain.
Assume that the variables x and
y refer to strings. Write...
asked 3 minutes ago -
This table shows the US domestic demand and supply schedules
for oranges. Suppose the world price...
asked 2 minutes ago -
Please help me create a CLASS DIAGRAM for this code:
import pygame
from pygame.sprite import Sprite...
asked 4 minutes ago -
The Merriweather Printing Company is trying to decide on the
merits of constructing a new publishing...
asked 23 minutes ago -
29) Insulin is a water-soluble hormone transported in the blood.
Which describes a likely way in...
asked 29 minutes ago -
Harden, Harden, & Harden is a venerable Wall Street stock
brokerage firm. It has its business...
asked 30 minutes ago -
How do we determine the ultimate radioactive decay product of
the uranium-238 series is lead?
asked 34 minutes ago -
> Women’s pulse rates are normally distributed with a mean of
68.5 beats per minute and...
asked 41 minutes ago -
Briefly describe an aspect of the strengths perspective that is
consistent with your own understanding of...
asked 43 minutes ago -
Step by step method of using Sparse Identification of Nonlinear
Dynamics (SINDy) to model your own...
asked 50 minutes ago -
3) What are the typical social structures in a global city?
asked 3 hours ago -
Luther Corporation
Consolidated Balance Sheet
December 31, 2019 and 2018 (in $ millions)
Assets
2019
2018...
asked 3 hours ago