


Please include steps. (calculate for both 2010 &
2011)
I have attached all financial statements
Homework Answers
------ Inventory Turnover Ratios for 2010 and 2011.
Usually inventory turnover ratio = COGS/average inventory
where average inventory is (closing inventory of previous year + closing inventory of current year )/ 2
but in cases where we dont have closing inventory of previous year, we only take closing inventory of current year.
Here we will take current year closing for inventory.
Inventory turnover ratio = COGS/closing inventory of current year
| 2011 | 2010 | |
| COGS | 64431 | 39541 |
| Inventory | 776 | 1051 |
| Inventory Turnover | 83.02964 | 37.62226 |
-------------------Debt ratio = Total liabilities/total assets (expressed in percentage form)
| 2011 | 2010 | |
| Total Assets | 116371 | 75183 |
| Total Debt | 39756 | 27392 |
| Debt Ratio | 0.341632 | 0.364338 |
| 34.16% | 36.43% |
---------------------Times Interest Earned
Times interest earned : EBIT/Interest expense
Interest expense = EBIT - pre tax income
| 2011 | 2010 | |
| EBIT | 33790 | 18385 |
| Pretax income | 34205 | 18540 |
| Interest expense | -415 | -155 |
| (EBIT - Pretax income) | ||
| Times interest earned | -81.4217 | -118.613 |
Add Answer to:
Please include steps. (calculate for both 2010 &
2011)
I have attached all financial statements
Annual...
Please include steps. (calculate for 2010 & 2011) E E E E E E E E...
 Please include steps. (calculate for 2010 & 2011)
E E E E E E E E E E E EE E E E E Annual Data Millions of US $ except per share data 2011-09-30 2010-09-30 Cash On Hand $25,952 $25,620 Notes And Loans Receivable Inventory $776 $1,051 Other Current Assets $4,529 $3,447 Total Current Assets $44,988 $41,678 Property, Plant, And Equipment $7,777 $4,768 Long-Term Investments $55,618 $25,391 Goodwill And Intangible Assets $4,432 $1,083 Other Long-Term Assets $3,556 $2,263 Total...
Please include steps. (calculate for 2010 & 2011)
E E E E E E E E E E E EE E E E E Annual Data Millions of US $ except per share data 2011-09-30 2010-09-30 Cash On Hand $25,952 $25,620 Notes And Loans Receivable Inventory $776 $1,051 Other Current Assets $4,529 $3,447 Total Current Assets $44,988 $41,678 Property, Plant, And Equipment $7,777 $4,768 Long-Term Investments $55,618 $25,391 Goodwill And Intangible Assets $4,432 $1,083 Other Long-Term Assets $3,556 $2,263 Total...
Please include the steps. (calculate for 2010 & 2011) Annual Datal Millions of US $ except...
 Please include the steps. (calculate for 2010 &
2011)
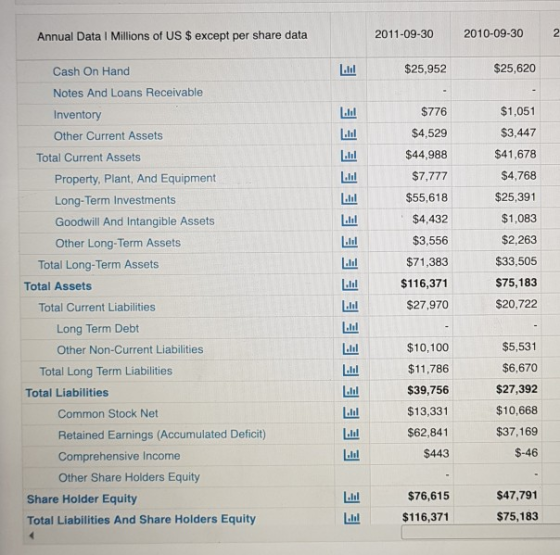
Annual Datal Millions of US $ except per share data 2011-09-30 2010-09-30 $25,952 $25,620 Cash On Hand Notes And Loans Receivable $1,051 $776 Inventory $4,529 $3,447 Other Current Assets $41,678 $44,988 Total Current Assets $7,777 $4,768 Property, Plant,And Equipment $55,618 $25,391 Lid Long-Term Investments $1,083 $4,432 Goodwill And Intangible Assets $2,263 $3,556 Other Long-Term Assets $71,383 $33,505 Total Long-Term Assets $75,183 $116,371 Total Assets $20,722 $27,970 Total Current Liabilities Long Term...
Please include the steps. (calculate for 2010 &
2011)
Annual Datal Millions of US $ except per share data 2011-09-30 2010-09-30 $25,952 $25,620 Cash On Hand Notes And Loans Receivable $1,051 $776 Inventory $4,529 $3,447 Other Current Assets $41,678 $44,988 Total Current Assets $7,777 $4,768 Property, Plant,And Equipment $55,618 $25,391 Lid Long-Term Investments $1,083 $4,432 Goodwill And Intangible Assets $2,263 $3,556 Other Long-Term Assets $71,383 $33,505 Total Long-Term Assets $75,183 $116,371 Total Assets $20,722 $27,970 Total Current Liabilities Long Term...
Calculate the following ratios based on Wendy's 2017 and 2018 financial statements and comment on the...
 Calculate the following ratios based on Wendy's 2017 and 2018
financial statements and comment on the differences between FY 2017
and FY 2018.
Wendy's
FY 2017
FY 2018
Liquidity
Current Ratio:
Quick Ratio:
Comments on the companies' liquidity - what do the numbers
say?
Asset Management
Total Asset Turnover:
Avg Collection Period:
Comments on the companies' asset management - what do the numbers
say?
Debt Management
Total Debt to Total Assets:
Times Interest Earned:
Comments on the companies' debt management...
Calculate the following ratios based on Wendy's 2017 and 2018
financial statements and comment on the differences between FY 2017
and FY 2018.
Wendy's
FY 2017
FY 2018
Liquidity
Current Ratio:
Quick Ratio:
Comments on the companies' liquidity - what do the numbers
say?
Asset Management
Total Asset Turnover:
Avg Collection Period:
Comments on the companies' asset management - what do the numbers
say?
Debt Management
Total Debt to Total Assets:
Times Interest Earned:
Comments on the companies' debt management...
Consolidated Statements of Earnings For Fiscal Years Ended ($ millions) February 26, 2011 February 27, 2010...
 Consolidated Statements of Earnings For Fiscal Years Ended ($ millions) February 26, 2011 February 27, 2010 February 28, 2009 Revenue 50.272 $ 49,694 $ 45,015 Cost of goods sold 37 611 37,534 34,017 Restructuring charges - cost of goods sold Gross Profit 12,637 12,160 10,998 Selling general and administrative expenses 10.325 9,873 Restructuring charges Goodwill and tradename impairment Operating income 2,235 1,870 Other income (expense) Investment income and other 54 Investment impairment (111) Interest expense (94) Earnings before income tax...
indings. P 8-5 Day Ko Incorporated presented the following comparative income statements for 2011 and 2010:...
 indings. P 8-5 Day Ko Incorporated presented the following comparative income statements for 2011 and 2010: For the Years Ended 2011 2010 Net sales $1,589,150 22,334 1,611,484 $1,294,966 20,822 Other income 1,315,788 Costs and expenses: Material and manufacturing costs of products sold Research and development General and selling Interest Other 651,390 135,314 526,680 18,768 15,570 1,347,722 263,762 466,250 113,100 446,110 11,522 7,306 1,044,288 271,500 121,740 149,760 12,650 137,110 Earnings before income taxes and noncontrolling interest Provision for income taxes Earnings...
create a contingency table for gpa Balance Sheet: 2011 2010 2011 2010 Cash and equivalents 9,000...
 create a contingency table for gpa
Balance Sheet: 2011 2010 2011 2010 Cash and equivalents 9,000 10,800 13,000 Accounts payable 14,000 6,700 Accounts receivable 5,150 Notes payable 30,000 25,000 6,000 28.125 Inventories 7.600 21.000 Accruals 72,125 Total current assets Total current abilities 25,100 59,000 47.000 20,150 15,000 50,000 Net fixed assets 15,000 Long-term debt Total debt 40,100 35,150 Common stock 50,000 50,000 Retained earnings 32,025 20,850 Total equity 82.925 70,850 106,000 Total assets 122,125 106,000 Total liab, and equity 122,125...
create a contingency table for gpa
Balance Sheet: 2011 2010 2011 2010 Cash and equivalents 9,000 10,800 13,000 Accounts payable 14,000 6,700 Accounts receivable 5,150 Notes payable 30,000 25,000 6,000 28.125 Inventories 7.600 21.000 Accruals 72,125 Total current assets Total current abilities 25,100 59,000 47.000 20,150 15,000 50,000 Net fixed assets 15,000 Long-term debt Total debt 40,100 35,150 Common stock 50,000 50,000 Retained earnings 32,025 20,850 Total equity 82.925 70,850 106,000 Total assets 122,125 106,000 Total liab, and equity 122,125...
Balance Sheet Feb. 26, 2011 Feb. 27, 2010 (S millions) Cash and cash equivalents Short-term inves...
 We were unable to transcribe this imageBalance Sheet Feb. 26, 2011 Feb. 27, 2010 (S millions) Cash and cash equivalents Short-term investments Receivables 1,103 1,826 90 2,020 2,348 5,897 1,103 10,473 Merchandise inventories Other current assets Total current assets Property and equipment Land and buildings Leasehold improvements Fixtures and equipment Property under capital lease Gross property and equipment Less accumulated depreciation Net property and equipment 5,486 1,144 10,566 766 2,318 4,701 120 7,905 4,082 3,823 2,454 133 203 328 435...
How do I identify which accounting method Netflix used based on the 2018 financial statement? How...
 How do I identify which accounting method Netflix used based on
the 2018 financial statement? How does the company treat its
intangible assets/amortization?
Income Statement Balance Sheet Cash Flow Statement Key Financial Ratios Format: Annual Search for ticker or company nam Annual Data Millions of US S except per share data 2018-12-31 2017-12-31 2016-12-31 Revenue Cost Of Goods Sold Gross Profit Research And Development Expenses SG&A Expenses Other Operating Income Or Expenses Operating Expenses Operating Income Total Non-Operating Income/Expense $15,794.34...
How do I identify which accounting method Netflix used based on
the 2018 financial statement? How does the company treat its
intangible assets/amortization?
Income Statement Balance Sheet Cash Flow Statement Key Financial Ratios Format: Annual Search for ticker or company nam Annual Data Millions of US S except per share data 2018-12-31 2017-12-31 2016-12-31 Revenue Cost Of Goods Sold Gross Profit Research And Development Expenses SG&A Expenses Other Operating Income Or Expenses Operating Expenses Operating Income Total Non-Operating Income/Expense $15,794.34...
Please show all work. 1. Statement of Cash Flows and Standardized Financial Statements a) Net income...
 Please show all work. 1. Statement of Cash Flows and Standardized Financial Statements a) Net income for your firm was $10,000 last year. The depreciation expense was $2,500; accounts receivable increased $1,250; accounts payable increased $800; and inventories increased by $2,000. Identify the sources and uses of cash • What was the total cash flow from operations for the period? Operating activities = Net Income + Depreciation + Source (inflow) - Use foutflow) b) i) Prepare the 2018 common-size Income...
 Please include steps. (calculate for 2010 & 2011)
E E E E E E E E E E E EE E E E E Annual Data Millions of US $ except per share data 2011-09-30 2010-09-30 Cash On Hand $25,952 $25,620 Notes And Loans Receivable Inventory $776 $1,051 Other Current Assets $4,529 $3,447 Total Current Assets $44,988 $41,678 Property, Plant, And Equipment $7,777 $4,768 Long-Term Investments $55,618 $25,391 Goodwill And Intangible Assets $4,432 $1,083 Other Long-Term Assets $3,556 $2,263 Total...
Please include steps. (calculate for 2010 & 2011)
E E E E E E E E E E E EE E E E E Annual Data Millions of US $ except per share data 2011-09-30 2010-09-30 Cash On Hand $25,952 $25,620 Notes And Loans Receivable Inventory $776 $1,051 Other Current Assets $4,529 $3,447 Total Current Assets $44,988 $41,678 Property, Plant, And Equipment $7,777 $4,768 Long-Term Investments $55,618 $25,391 Goodwill And Intangible Assets $4,432 $1,083 Other Long-Term Assets $3,556 $2,263 Total...
 Please include the steps. (calculate for 2010 &
2011)
Annual Datal Millions of US $ except per share data 2011-09-30 2010-09-30 $25,952 $25,620 Cash On Hand Notes And Loans Receivable $1,051 $776 Inventory $4,529 $3,447 Other Current Assets $41,678 $44,988 Total Current Assets $7,777 $4,768 Property, Plant,And Equipment $55,618 $25,391 Lid Long-Term Investments $1,083 $4,432 Goodwill And Intangible Assets $2,263 $3,556 Other Long-Term Assets $71,383 $33,505 Total Long-Term Assets $75,183 $116,371 Total Assets $20,722 $27,970 Total Current Liabilities Long Term...
Please include the steps. (calculate for 2010 &
2011)
Annual Datal Millions of US $ except per share data 2011-09-30 2010-09-30 $25,952 $25,620 Cash On Hand Notes And Loans Receivable $1,051 $776 Inventory $4,529 $3,447 Other Current Assets $41,678 $44,988 Total Current Assets $7,777 $4,768 Property, Plant,And Equipment $55,618 $25,391 Lid Long-Term Investments $1,083 $4,432 Goodwill And Intangible Assets $2,263 $3,556 Other Long-Term Assets $71,383 $33,505 Total Long-Term Assets $75,183 $116,371 Total Assets $20,722 $27,970 Total Current Liabilities Long Term...
 Calculate the following ratios based on Wendy's 2017 and 2018
financial statements and comment on the differences between FY 2017
and FY 2018.
Wendy's
FY 2017
FY 2018
Liquidity
Current Ratio:
Quick Ratio:
Comments on the companies' liquidity - what do the numbers
say?
Asset Management
Total Asset Turnover:
Avg Collection Period:
Comments on the companies' asset management - what do the numbers
say?
Debt Management
Total Debt to Total Assets:
Times Interest Earned:
Comments on the companies' debt management...
Calculate the following ratios based on Wendy's 2017 and 2018
financial statements and comment on the differences between FY 2017
and FY 2018.
Wendy's
FY 2017
FY 2018
Liquidity
Current Ratio:
Quick Ratio:
Comments on the companies' liquidity - what do the numbers
say?
Asset Management
Total Asset Turnover:
Avg Collection Period:
Comments on the companies' asset management - what do the numbers
say?
Debt Management
Total Debt to Total Assets:
Times Interest Earned:
Comments on the companies' debt management...
 Consolidated Statements of Earnings For Fiscal Years Ended ($ millions) February 26, 2011 February 27, 2010 February 28, 2009 Revenue 50.272 $ 49,694 $ 45,015 Cost of goods sold 37 611 37,534 34,017 Restructuring charges - cost of goods sold Gross Profit 12,637 12,160 10,998 Selling general and administrative expenses 10.325 9,873 Restructuring charges Goodwill and tradename impairment Operating income 2,235 1,870 Other income (expense) Investment income and other 54 Investment impairment (111) Interest expense (94) Earnings before income tax...
 indings. P 8-5 Day Ko Incorporated presented the following comparative income statements for 2011 and 2010: For the Years Ended 2011 2010 Net sales $1,589,150 22,334 1,611,484 $1,294,966 20,822 Other income 1,315,788 Costs and expenses: Material and manufacturing costs of products sold Research and development General and selling Interest Other 651,390 135,314 526,680 18,768 15,570 1,347,722 263,762 466,250 113,100 446,110 11,522 7,306 1,044,288 271,500 121,740 149,760 12,650 137,110 Earnings before income taxes and noncontrolling interest Provision for income taxes Earnings...
 create a contingency table for gpa
Balance Sheet: 2011 2010 2011 2010 Cash and equivalents 9,000 10,800 13,000 Accounts payable 14,000 6,700 Accounts receivable 5,150 Notes payable 30,000 25,000 6,000 28.125 Inventories 7.600 21.000 Accruals 72,125 Total current assets Total current abilities 25,100 59,000 47.000 20,150 15,000 50,000 Net fixed assets 15,000 Long-term debt Total debt 40,100 35,150 Common stock 50,000 50,000 Retained earnings 32,025 20,850 Total equity 82.925 70,850 106,000 Total assets 122,125 106,000 Total liab, and equity 122,125...
create a contingency table for gpa
Balance Sheet: 2011 2010 2011 2010 Cash and equivalents 9,000 10,800 13,000 Accounts payable 14,000 6,700 Accounts receivable 5,150 Notes payable 30,000 25,000 6,000 28.125 Inventories 7.600 21.000 Accruals 72,125 Total current assets Total current abilities 25,100 59,000 47.000 20,150 15,000 50,000 Net fixed assets 15,000 Long-term debt Total debt 40,100 35,150 Common stock 50,000 50,000 Retained earnings 32,025 20,850 Total equity 82.925 70,850 106,000 Total assets 122,125 106,000 Total liab, and equity 122,125...
 We were unable to transcribe this imageBalance Sheet Feb. 26, 2011 Feb. 27, 2010 (S millions) Cash and cash equivalents Short-term investments Receivables 1,103 1,826 90 2,020 2,348 5,897 1,103 10,473 Merchandise inventories Other current assets Total current assets Property and equipment Land and buildings Leasehold improvements Fixtures and equipment Property under capital lease Gross property and equipment Less accumulated depreciation Net property and equipment 5,486 1,144 10,566 766 2,318 4,701 120 7,905 4,082 3,823 2,454 133 203 328 435...
 How do I identify which accounting method Netflix used based on
the 2018 financial statement? How does the company treat its
intangible assets/amortization?
Income Statement Balance Sheet Cash Flow Statement Key Financial Ratios Format: Annual Search for ticker or company nam Annual Data Millions of US S except per share data 2018-12-31 2017-12-31 2016-12-31 Revenue Cost Of Goods Sold Gross Profit Research And Development Expenses SG&A Expenses Other Operating Income Or Expenses Operating Expenses Operating Income Total Non-Operating Income/Expense $15,794.34...
How do I identify which accounting method Netflix used based on
the 2018 financial statement? How does the company treat its
intangible assets/amortization?
Income Statement Balance Sheet Cash Flow Statement Key Financial Ratios Format: Annual Search for ticker or company nam Annual Data Millions of US S except per share data 2018-12-31 2017-12-31 2016-12-31 Revenue Cost Of Goods Sold Gross Profit Research And Development Expenses SG&A Expenses Other Operating Income Or Expenses Operating Expenses Operating Income Total Non-Operating Income/Expense $15,794.34...
 Please show all work. 1. Statement of Cash Flows and Standardized Financial Statements a) Net income for your firm was $10,000 last year. The depreciation expense was $2,500; accounts receivable increased $1,250; accounts payable increased $800; and inventories increased by $2,000. Identify the sources and uses of cash • What was the total cash flow from operations for the period? Operating activities = Net Income + Depreciation + Source (inflow) - Use foutflow) b) i) Prepare the 2018 common-size Income...
Most questions answered within 3 hours.
-
5. Explain the condition for a DC motor to develop the
maximum power. If a DC...
asked 2 minutes ago -
Compute the p[Ag] after 35.00 mL of 0.1 M silver nitrate has been
added to the...
asked 5 minutes ago -
Walgreen Company (NYSE: WAG) is currently trading at $48.50 on
the NYSE. Walgreen Company is also...
asked 19 minutes ago -
Based on historical data, your team knows what proportion of the
company's orders come from Males...
asked 37 minutes ago -
8. Which of the following atoms has the largest magnitude
electron affinity?
(a) Sodium (Na)
(b)...
asked 39 minutes ago -
Assess the two types of tests of cognitive abilities. (
regarding HR course)
asked 44 minutes ago -
1.Write an inspiring vision statement for an organization where
you work or have worked. If the...
asked 45 minutes ago -
2. Is fair trade coffee sustainable for the mass market,
or is it a niche product...
asked 46 minutes ago -
Please answer this asap in MATLAB.
In the following for loop, the the loop is executed...
asked 58 minutes ago -
A 50.0-g golf ball is driven from the tee with an initial speed
of 44.6 m/s...
asked 53 minutes ago -
Use the molar concentration of the 50 mL solution to calculate
the moles of Cr(III) in...
asked 56 minutes ago -
Calculate the molarity of Fe3+ in solution A.
Solution A: 10 mL of 0.0600 M Fe(No3)3 ...
asked 1 hour ago