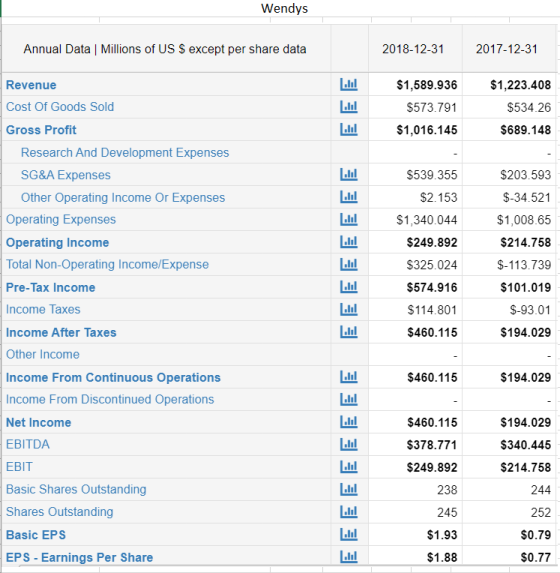
Calculate the following ratios based on Wendy's 2017 and 2018 financial statements and comment on the differences between FY 2017 and FY 2018.
| Wendy's | |||
| FY 2017 | FY 2018 | ||
| Liquidity | Current Ratio: | ||
| Quick Ratio: | |||
| Comments on the companies' liquidity - what do the numbers say? | |||
| Asset Management | Total Asset Turnover: | ||
| Avg Collection Period: | |||
| Comments on the companies' asset management - what do the numbers say? | |||
| Debt Management | Total Debt to Total Assets: | ||
| Times Interest Earned: | |||
| Comments on the companies' debt management - what do the numbers say? | |||
| Profitability | Net Profit Margin: | ||
| Return on Assets: | |||
| Return on Equity: | |||
| Modified Du Point Equation, FY 2012: | |||
| Comments on the companies' profitability - what do the numbers say? | |||
| Market Value Ratios | PE Ratio: | ||
| Market to Book Ratio: | |||
| Comments on the companies' market values ratios - what do the numbers say? | |||


Homework Answers
| Wendy's | |||
| Ratio | FY 2018 | FY 2017 | |
| Liquidity | |||
| A | Current Ratio | $665.718/ $284.185 | $404.353/ $227.162 |
| Current Assets/Current Liabilities | 2.34 times | 1.78 times | |
| Comments | It means that for every dollar that the firm owes its creditors, it is owed $2.34 by its debtors. | It means that for every dollar that the firm owes its creditors, it is owed $1.78 by its debtors. | |
| Current Ratio
measures the entity's ability to pay short term obligations. Ideal
ratio is 2:1. As of the FY 2018, The company’s liquidity is good. |
|||
| B | Quick Ratio | ||
| Cash, Marketable securities & receivables/ Current Liabilities | $461.265/ $284.185 | $204.08/ 227.162 | |
| 1.62:1 | 0.89:1 | ||
| Comments | Quick ratio of 1.62 times implies the company's liquidity is good and ability to meet current obligations using liquid assets. | Quick ratio of less than 1 means the firm can't fully pay back its current liabilities. | |
| Quick ratio, also
known as the acid-test measures the ability of a firm to use its
near cash or quick assets to extinguish or retire its current
liabilities immediately. Normal ratio is 1:1. As of the FY 2018, The company liquidity is good. |
|||
Add Answer to:
Calculate the following ratios based on Wendy's 2017 and 2018
financial statements and comment on the...
Use the following financial statements for Lake of Egypt Marina, Inc. 2018 2017 $ 48 $...
 Use the following financial statements for Lake of Egypt Marina, Inc. 2018 2017 $ 48 $ 50 55 44 Assets Current assets: Cash and marketable securities Accounts receivable Inventory Total Fixed assets: Gross plant and equipment Less: Depreciation 40 LAKE OF EGYPT MARINA, INC. Balance Sheet as of December 31, 2018 and 2017 (in millions of dollars) 2018 2017 Liabilities and Equity Current liabilities: $ 50 $ 56 Accrued wages and taxes 60 52 Accounts payable 205 Notes payable $315...
Calculate the following financial ratios for fiscal year 2018 only using the "Consolidated Statements of Earn"...
 Calculate the following financial ratios for fiscal year 2018
only using the "Consolidated Statements of Earn" and "Consolidated
Balance Sheets" worksheets in Starbucks 2017 and 2018 Annual
Financial Statements : Current Ratio, Cash Ratio, Inventory
Turnover, Days Sales in Inventory, Long Term Debt Ratio, Times
Interest Earned, Gross Profit Margin, Net Profit Margin, Return on
Equity, Return on Assets.
12 Months Ended Oct. 01, 2017 Sep. 30, 2018 Oct. 02, 2016 $ 22,386.8 9,034,3 6,493.3 500.3 1,011.4 1,450.7 153.5 18,643.5...
Calculate the following financial ratios for fiscal year 2018
only using the "Consolidated Statements of Earn" and "Consolidated
Balance Sheets" worksheets in Starbucks 2017 and 2018 Annual
Financial Statements : Current Ratio, Cash Ratio, Inventory
Turnover, Days Sales in Inventory, Long Term Debt Ratio, Times
Interest Earned, Gross Profit Margin, Net Profit Margin, Return on
Equity, Return on Assets.
12 Months Ended Oct. 01, 2017 Sep. 30, 2018 Oct. 02, 2016 $ 22,386.8 9,034,3 6,493.3 500.3 1,011.4 1,450.7 153.5 18,643.5...
Calculate the following financial ratios for fiscal year 2018 only using the "Consolidated Statements of Earn"...
 Calculate the following financial ratios for fiscal year 2018
only using the "Consolidated Statements of Earn" and "Consolidated
Balance Sheets" worksheets in Starbucks 2017 and 2018 Annual
Financial Statements: Current Ratio, Cash Ratio, Inventory
Turnover, Days Sales in Inventory, Long Term Debt Ratio, Times
Interest Earned, Gross Profit Margin, Net Profit Margin, Return on
Equity, Return on Assets.
12 Months Ended Oct. 01, 2017 Sep. 30, 2018 Oct. 02, 2016 $ 22,386.8 9,034,3 6,493.3 500.3 1,011.4 1,450.7 153.5 18,643.5 $...
Calculate the following financial ratios for fiscal year 2018
only using the "Consolidated Statements of Earn" and "Consolidated
Balance Sheets" worksheets in Starbucks 2017 and 2018 Annual
Financial Statements: Current Ratio, Cash Ratio, Inventory
Turnover, Days Sales in Inventory, Long Term Debt Ratio, Times
Interest Earned, Gross Profit Margin, Net Profit Margin, Return on
Equity, Return on Assets.
12 Months Ended Oct. 01, 2017 Sep. 30, 2018 Oct. 02, 2016 $ 22,386.8 9,034,3 6,493.3 500.3 1,011.4 1,450.7 153.5 18,643.5 $...
Calculate the following financial ratios for fiscal year 2018 only using the "Consolidated Statements of Earn"...
 Calculate the following financial ratios for fiscal year 2018
only using the "Consolidated Statements of Earn" and "Consolidated
Balance Sheets" worksheets in Starbucks 2017 and 2018 Annual
Financial Statements : Current Ratio, Cash Ratio, Inventory
Turnover, Days Sales in Inventory, Long Term Debt Ratio, Times
Interest Earned, Gross Profit Margin, Net Profit Margin, Return on
Equity, Return on Assets.
12 Months Ended Oct. 01, 2017 Sep. 30, 2018 Oct. 02, 2016 $ 22,386.8 9,034,3 6,493.3 500.3 1,011.4 1,450.7 153.5 18,643.5...
Calculate the following financial ratios for fiscal year 2018
only using the "Consolidated Statements of Earn" and "Consolidated
Balance Sheets" worksheets in Starbucks 2017 and 2018 Annual
Financial Statements : Current Ratio, Cash Ratio, Inventory
Turnover, Days Sales in Inventory, Long Term Debt Ratio, Times
Interest Earned, Gross Profit Margin, Net Profit Margin, Return on
Equity, Return on Assets.
12 Months Ended Oct. 01, 2017 Sep. 30, 2018 Oct. 02, 2016 $ 22,386.8 9,034,3 6,493.3 500.3 1,011.4 1,450.7 153.5 18,643.5...
How do I identify which accounting method Netflix used based on the 2018 financial statement? How...
 How do I identify which accounting method Netflix used based on
the 2018 financial statement? How does the company treat its
intangible assets/amortization?
Income Statement Balance Sheet Cash Flow Statement Key Financial Ratios Format: Annual Search for ticker or company nam Annual Data Millions of US S except per share data 2018-12-31 2017-12-31 2016-12-31 Revenue Cost Of Goods Sold Gross Profit Research And Development Expenses SG&A Expenses Other Operating Income Or Expenses Operating Expenses Operating Income Total Non-Operating Income/Expense $15,794.34...
How do I identify which accounting method Netflix used based on
the 2018 financial statement? How does the company treat its
intangible assets/amortization?
Income Statement Balance Sheet Cash Flow Statement Key Financial Ratios Format: Annual Search for ticker or company nam Annual Data Millions of US S except per share data 2018-12-31 2017-12-31 2016-12-31 Revenue Cost Of Goods Sold Gross Profit Research And Development Expenses SG&A Expenses Other Operating Income Or Expenses Operating Expenses Operating Income Total Non-Operating Income/Expense $15,794.34...
Using the following information: Calculate the following ratios for Urban Outfitters for both 2016 and 2017...
 Using the following information:
Calculate the following ratios for Urban Outfitters for
both 2016 and
2017 (show calculations):
a. Gross profit margin
b. Operating profit margin
c. Net profit margin
d. Times interest earned coverage
e. Return on shareholders’ equity
f. Return on assets
g. Debt-to-equity ratio
h. Days of inventory
i. Inventory turnover ratio
j. Average collection period
Consolidated Income Statements for Urban ters, Inc. 2016 2017 $3.545.794 $3,445,134 Net sales (total revenue) 2,301,181 2,243,232 Cost of sales 906,086...
Using the following information:
Calculate the following ratios for Urban Outfitters for
both 2016 and
2017 (show calculations):
a. Gross profit margin
b. Operating profit margin
c. Net profit margin
d. Times interest earned coverage
e. Return on shareholders’ equity
f. Return on assets
g. Debt-to-equity ratio
h. Days of inventory
i. Inventory turnover ratio
j. Average collection period
Consolidated Income Statements for Urban ters, Inc. 2016 2017 $3.545.794 $3,445,134 Net sales (total revenue) 2,301,181 2,243,232 Cost of sales 906,086...
Use the following financial statements for Lake of Egypt Marina, Inc. 2018 2017 LAKE OF EGYPT...
 Use the following financial statements for Lake of Egypt Marina, Inc. 2018 2017 LAKE OF EGYPT MARINA, INC. Balance Sheet as of December 31, 2018 and 2017 (in millions of dollars) 2018 2017 Liabilities and Equity Current liabilities: $ 50 $ 56 Accrued wages and taxes 60 52 Accounts payable 205 Notes payable $315 $204 Total $ 48 $ 50 55 Assets Current assets: Cash and marketable securities Accounts receivable Inventory Total Fixed assets: Gross plant and equipment Less: Depreciation...
QUESTION 3 From following financial statements, calculate following ratios and analyse the current year and previous...
 QUESTION 3 From following financial statements, calculate following ratios and analyse the current year and previous year performance a) Current ratio. b) Days sales outstanding (DSO). (Sales 2017 RM500m & Sales 2018 RM600m) c) Inventory turnover ratio d) Total debt to assets e) Return on assets (ROA) (Net income 2017 RM42m &Net income 2018 RM58m) Moon Inc. Balance Sheet (RM millions) as at December 31, 2015 and 2016 2015 21 51 2016 20 84 Cash Accounts receivable Inventory Prepaid expenses...
Use the following financial statements for Lake of Egypt Marina, Inc. 2018 2017 $ 40 $...
 Use the following financial statements for Lake of Egypt Marina, Inc. 2018 2017 $ 40 $ 36 45 52 LAKE OF EGYPT MARINA, INC. Balance sheet as of December 31, 2018 and 2017 (in millions of dollars) 2018 2017 Assets Liabilities and Equity Current assets: Current liabilities: Cash and marketable securities $ 55 S 48 Accrued wages and taxes Accounts receivable Accounts payable Inventory 180 Notes payable Total Total Fixed assets: Long-term debt: Gross plant and equipment $265 $ 224...
 Use the following financial statements for Lake of Egypt Marina, Inc. 2018 2017 $ 48 $ 50 55 44 Assets Current assets: Cash and marketable securities Accounts receivable Inventory Total Fixed assets: Gross plant and equipment Less: Depreciation 40 LAKE OF EGYPT MARINA, INC. Balance Sheet as of December 31, 2018 and 2017 (in millions of dollars) 2018 2017 Liabilities and Equity Current liabilities: $ 50 $ 56 Accrued wages and taxes 60 52 Accounts payable 205 Notes payable $315...
 Calculate the following financial ratios for fiscal year 2018
only using the "Consolidated Statements of Earn" and "Consolidated
Balance Sheets" worksheets in Starbucks 2017 and 2018 Annual
Financial Statements : Current Ratio, Cash Ratio, Inventory
Turnover, Days Sales in Inventory, Long Term Debt Ratio, Times
Interest Earned, Gross Profit Margin, Net Profit Margin, Return on
Equity, Return on Assets.
12 Months Ended Oct. 01, 2017 Sep. 30, 2018 Oct. 02, 2016 $ 22,386.8 9,034,3 6,493.3 500.3 1,011.4 1,450.7 153.5 18,643.5...
Calculate the following financial ratios for fiscal year 2018
only using the "Consolidated Statements of Earn" and "Consolidated
Balance Sheets" worksheets in Starbucks 2017 and 2018 Annual
Financial Statements : Current Ratio, Cash Ratio, Inventory
Turnover, Days Sales in Inventory, Long Term Debt Ratio, Times
Interest Earned, Gross Profit Margin, Net Profit Margin, Return on
Equity, Return on Assets.
12 Months Ended Oct. 01, 2017 Sep. 30, 2018 Oct. 02, 2016 $ 22,386.8 9,034,3 6,493.3 500.3 1,011.4 1,450.7 153.5 18,643.5...
 Calculate the following financial ratios for fiscal year 2018
only using the "Consolidated Statements of Earn" and "Consolidated
Balance Sheets" worksheets in Starbucks 2017 and 2018 Annual
Financial Statements: Current Ratio, Cash Ratio, Inventory
Turnover, Days Sales in Inventory, Long Term Debt Ratio, Times
Interest Earned, Gross Profit Margin, Net Profit Margin, Return on
Equity, Return on Assets.
12 Months Ended Oct. 01, 2017 Sep. 30, 2018 Oct. 02, 2016 $ 22,386.8 9,034,3 6,493.3 500.3 1,011.4 1,450.7 153.5 18,643.5 $...
Calculate the following financial ratios for fiscal year 2018
only using the "Consolidated Statements of Earn" and "Consolidated
Balance Sheets" worksheets in Starbucks 2017 and 2018 Annual
Financial Statements: Current Ratio, Cash Ratio, Inventory
Turnover, Days Sales in Inventory, Long Term Debt Ratio, Times
Interest Earned, Gross Profit Margin, Net Profit Margin, Return on
Equity, Return on Assets.
12 Months Ended Oct. 01, 2017 Sep. 30, 2018 Oct. 02, 2016 $ 22,386.8 9,034,3 6,493.3 500.3 1,011.4 1,450.7 153.5 18,643.5 $...
 Calculate the following financial ratios for fiscal year 2018
only using the "Consolidated Statements of Earn" and "Consolidated
Balance Sheets" worksheets in Starbucks 2017 and 2018 Annual
Financial Statements : Current Ratio, Cash Ratio, Inventory
Turnover, Days Sales in Inventory, Long Term Debt Ratio, Times
Interest Earned, Gross Profit Margin, Net Profit Margin, Return on
Equity, Return on Assets.
12 Months Ended Oct. 01, 2017 Sep. 30, 2018 Oct. 02, 2016 $ 22,386.8 9,034,3 6,493.3 500.3 1,011.4 1,450.7 153.5 18,643.5...
Calculate the following financial ratios for fiscal year 2018
only using the "Consolidated Statements of Earn" and "Consolidated
Balance Sheets" worksheets in Starbucks 2017 and 2018 Annual
Financial Statements : Current Ratio, Cash Ratio, Inventory
Turnover, Days Sales in Inventory, Long Term Debt Ratio, Times
Interest Earned, Gross Profit Margin, Net Profit Margin, Return on
Equity, Return on Assets.
12 Months Ended Oct. 01, 2017 Sep. 30, 2018 Oct. 02, 2016 $ 22,386.8 9,034,3 6,493.3 500.3 1,011.4 1,450.7 153.5 18,643.5...
 How do I identify which accounting method Netflix used based on
the 2018 financial statement? How does the company treat its
intangible assets/amortization?
Income Statement Balance Sheet Cash Flow Statement Key Financial Ratios Format: Annual Search for ticker or company nam Annual Data Millions of US S except per share data 2018-12-31 2017-12-31 2016-12-31 Revenue Cost Of Goods Sold Gross Profit Research And Development Expenses SG&A Expenses Other Operating Income Or Expenses Operating Expenses Operating Income Total Non-Operating Income/Expense $15,794.34...
How do I identify which accounting method Netflix used based on
the 2018 financial statement? How does the company treat its
intangible assets/amortization?
Income Statement Balance Sheet Cash Flow Statement Key Financial Ratios Format: Annual Search for ticker or company nam Annual Data Millions of US S except per share data 2018-12-31 2017-12-31 2016-12-31 Revenue Cost Of Goods Sold Gross Profit Research And Development Expenses SG&A Expenses Other Operating Income Or Expenses Operating Expenses Operating Income Total Non-Operating Income/Expense $15,794.34...
 Using the following information:
Calculate the following ratios for Urban Outfitters for
both 2016 and
2017 (show calculations):
a. Gross profit margin
b. Operating profit margin
c. Net profit margin
d. Times interest earned coverage
e. Return on shareholders’ equity
f. Return on assets
g. Debt-to-equity ratio
h. Days of inventory
i. Inventory turnover ratio
j. Average collection period
Consolidated Income Statements for Urban ters, Inc. 2016 2017 $3.545.794 $3,445,134 Net sales (total revenue) 2,301,181 2,243,232 Cost of sales 906,086...
Using the following information:
Calculate the following ratios for Urban Outfitters for
both 2016 and
2017 (show calculations):
a. Gross profit margin
b. Operating profit margin
c. Net profit margin
d. Times interest earned coverage
e. Return on shareholders’ equity
f. Return on assets
g. Debt-to-equity ratio
h. Days of inventory
i. Inventory turnover ratio
j. Average collection period
Consolidated Income Statements for Urban ters, Inc. 2016 2017 $3.545.794 $3,445,134 Net sales (total revenue) 2,301,181 2,243,232 Cost of sales 906,086...
 Use the following financial statements for Lake of Egypt Marina, Inc. 2018 2017 LAKE OF EGYPT MARINA, INC. Balance Sheet as of December 31, 2018 and 2017 (in millions of dollars) 2018 2017 Liabilities and Equity Current liabilities: $ 50 $ 56 Accrued wages and taxes 60 52 Accounts payable 205 Notes payable $315 $204 Total $ 48 $ 50 55 Assets Current assets: Cash and marketable securities Accounts receivable Inventory Total Fixed assets: Gross plant and equipment Less: Depreciation...
 QUESTION 3 From following financial statements, calculate following ratios and analyse the current year and previous year performance a) Current ratio. b) Days sales outstanding (DSO). (Sales 2017 RM500m & Sales 2018 RM600m) c) Inventory turnover ratio d) Total debt to assets e) Return on assets (ROA) (Net income 2017 RM42m &Net income 2018 RM58m) Moon Inc. Balance Sheet (RM millions) as at December 31, 2015 and 2016 2015 21 51 2016 20 84 Cash Accounts receivable Inventory Prepaid expenses...
 Use the following financial statements for Lake of Egypt Marina, Inc. 2018 2017 $ 40 $ 36 45 52 LAKE OF EGYPT MARINA, INC. Balance sheet as of December 31, 2018 and 2017 (in millions of dollars) 2018 2017 Assets Liabilities and Equity Current assets: Current liabilities: Cash and marketable securities $ 55 S 48 Accrued wages and taxes Accounts receivable Accounts payable Inventory 180 Notes payable Total Total Fixed assets: Long-term debt: Gross plant and equipment $265 $ 224...
Most questions answered within 3 hours.
-
D. A student completed 20 courses in the School of Arts and
Sciences. Her grades in...
asked 16 minutes ago -
teo
pucks moving on a frictionless air table are about to collide. the
1.5 kg puck...
asked 22 minutes ago -
Problem #1
The area between Z = 0 and Z = 2.50
The area between Z...
asked 2 hours ago -
1. What is the meaning of the term communication style?
2. What are the benefits to...
asked 1 hour ago -
9.) You are buying a car that cost $26,500. You make payments of
$412 each month...
asked 1 hour ago -
. Suppose a discrete random variable has probability
distribution
P(x) = .2 if x = 0...
asked 3 hours ago -
Under the influence of its drive force, a snowmobile is moving
at a constant velocity along...
asked 3 hours ago -
Why do organizations decline? What steps can top
management take to halt, decline, and restore organizational...
asked 3 hours ago -
What mechanisms Drive speciation??
(I.e. what was Dawins theory on the orgin of species, and how...
asked 4 hours ago -
The manager at a car assembly plant believes that the mean
assembly time for a car...
asked 5 hours ago -
Which of the following is true of electron capture?
A) It decreases the nuclide's mass number...
asked 7 hours ago -
Assuming an efficiency of 43.10%, calculate the actual yield of
magnesium nitrate formed from 114.9 g...
asked 7 hours ago