
Homework Answers

a) From scatter plot, there is positive linear relationship between x and y.
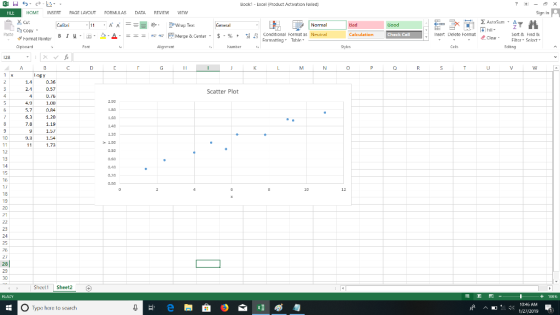
b) From scatter plot, there is perfect positive linear relationship between x and y.
c) In part a we have positive linear relationship between x and y and in part b we have perfect positive linear relationship between x and y therefore it would be easier to work with x and ln y.
Add Answer to:
For the following data: x 1.4 2.4 4.0 4.9 5.7 6.3 7.8 9.0 9.3 11.0 v...
Using the data file provided with both variables, x and y, answer the following questions using...
Using the data file provided with both variables, x and y, answer the following questions using Excel*: 1.Create a scatterplot with the data. Comment on direction, form, strength, outliers and/or other significant findings. 2.Use the linear model to fit a line to the data and determine the equation ỹ = b0 + b1x and Interpret b0and b1. 3.Calculate the coefficient of correlation. Discuss the strength of correlation between the explanatory and response variables. 4.Predict the value for ỹ when you...
CASE 1-5 Financial Statement Ratio Computation Refer to Campbell Soup Company's financial Campbell Soup statements in...
 CASE 1-5 Financial Statement Ratio Computation Refer to Campbell Soup Company's financial Campbell Soup statements in Appendix A. Required: Compute the following ratios for Year 11. Liquidity ratios: Asset utilization ratios:* a. Current ratio n. Cash turnover b. Acid-test ratio 0. Accounts receivable turnover c. Days to sell inventory p. Inventory turnover d. Collection period 4. Working capital turnover Capital structure and solvency ratios: 1. Fixed assets turnover e. Total debt to total equity s. Total assets turnover f. Long-term...
 CASE 1-5 Financial Statement Ratio Computation Refer to Campbell Soup Company's financial Campbell Soup statements in Appendix A. Required: Compute the following ratios for Year 11. Liquidity ratios: Asset utilization ratios:* a. Current ratio n. Cash turnover b. Acid-test ratio 0. Accounts receivable turnover c. Days to sell inventory p. Inventory turnover d. Collection period 4. Working capital turnover Capital structure and solvency ratios: 1. Fixed assets turnover e. Total debt to total equity s. Total assets turnover f. Long-term...
Most questions answered within 3 hours.
-
What is the mechanism of phthalic acid and m-xylene which
results in 2-(2,4-dimethylbenzoyl) benzoic acid ?...
asked 9 minutes ago -
describe business writing is
audience oriented
purposeful
Economical
asked 11 minutes ago -
Please explain how to solve these problems without using
excel.
A zero coupon bond has a...
asked 16 minutes ago -
Choose a disease that is caused by a defect in cell signaling.
Explain the cause of...
asked 16 minutes ago -
Oxford Company has limited funds available for investment and
must ration the funds among four competing...
asked 19 minutes ago -
Put your name on the first line in camelCase. Write a JavaScript
function to generate a...
asked 30 minutes ago -
Chapter 7 Telecommunications, the Internet, and Wireless
Technology:
Discuss some of the Internet services available to...
asked 33 minutes ago -
1. The college bookstore tells prospective students
that the average cost of its textbooks is $52...
asked 35 minutes ago -
A 2.5 kg block rests on a 30 ∘ slope and is attached by a string...
asked 45 minutes ago -
In C++ code language please:
1. Created a linked list
2. Insert 5 values: 1, 10,...
asked 49 minutes ago -
By analogy with automobiles, defects in cancer critical genes
have been likened to broken brakes and...
asked 1 hour ago -
Supposing Delta is an example of a very large US commercial
airline, how does the magnitude...
asked 1 hour ago