
Homework Answers
| Total effect | Substitution effect | Price effect | |
| Bob | +4 | +1 | +3 |
| Carol | +1 | +2 | -1 |
| Ted | +1 | +1 | 0 |
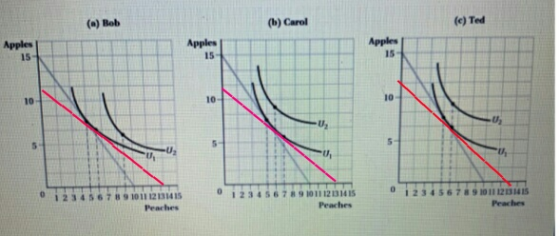
A. After price fall,
Bob consumes 9 peaches and 6 apples.
Carol consumes 6 peaches and 9 apples.
Ted consumes 6 peaches and 9 apples.
B. Substitution effect
For Bob, 6-5=1
For Carol, 7-5=2
For Ted, 6-5=1
C. Income effect
For Bob is 9-6÷3
For Carol is 6-7=1
For Ted is 6-6=0
D. For Bob peaches are normal good
For Ted peaches are income inelastic good
For Carol peaches are inferior good
Add Answer to:
3. (10%) In this question, we'll focus on Income and substitution effects. Consider the following three...
please be quick NSA 75BC-45DAY. 1994 # 2 of 2 OS Ted enjoys eating both apples...
 please be quick
NSA 75BC-45DAY. 1994 # 2 of 2 OS Ted enjoys eating both apples (A) and Peaches (P). He has $30 to spend on the two goods each week. Initially. apples cost $2 per pound and peaches cost $3 per pound Suppose the price of peaches falls to $2. Using the information from the table illustrate Tod's bedoeline, the new budget line, his 3 bundles (bundles A, B, and C), and two indifference curve sure to label everything...
please be quick
NSA 75BC-45DAY. 1994 # 2 of 2 OS Ted enjoys eating both apples (A) and Peaches (P). He has $30 to spend on the two goods each week. Initially. apples cost $2 per pound and peaches cost $3 per pound Suppose the price of peaches falls to $2. Using the information from the table illustrate Tod's bedoeline, the new budget line, his 3 bundles (bundles A, B, and C), and two indifference curve sure to label everything...
9. Income and substitution effects Carlos and Deborah Azinian live in Detroit and enjoy going out...
 9. Income and substitution effects Carlos and Deborah Azinian live in Detroit and enjoy going out to fancy restaurants for dinner and to diners for breakfast. On the following diagram, the purple curves 11 and 12 represent two of their indifference curves for fancy dinners and diner breakfasts. They have $1,000 per month available to spend on eating out. The price of a diner breakfast is always $10. Each labeled point represents the tangency between a budget constraint and the...
9. Income and substitution effects Larry and Megan Stein live in Detroit and enjoy going out...
 9. Income and substitution effects Larry and Megan Stein live in Detroit and enjoy going out to fancy restaurants for dinner and to diners for breakfast. On the following diagram, the purple curves 11 and 12 represent two of their indifference curves for fancy dinners and diner breakfasts. They have $1,000 per month available to spend on eating out. The price of a diner breakfast is always $10. Each labeled point represents the tangency between a budget constraint and the...
9. Income and substitution effects Dmitri and Frances Doherty live in Miami and enjoy going out...
 9. Income and substitution effects Dmitri and Frances Doherty live in Miami and enjoy going out to fancy restaurants for dinner and to diners for breakfast. On the following diagram, the purple curves 11 and 12 represent two of their indifference curves for fancy dinners and diner breakfasts. They have $1,000 per month available to spend on eating out. The price of a diner breakfast is always $10. Each labeled point represents the tangency between a budget constraint and the...
Homework (Ch 21) 9. Income and substitution effects Andrew and Beth Trimble live in Philadelphia and...
 Homework (Ch 21) 9. Income and substitution effects Andrew and Beth Trimble live in Philadelphia and enjoy going out to fancy restaurants for dinner and to diners for breakfast. On the following diagram, the purple curves I, and I, represent two of their indifference curves for fancy dinners and diner breakfasts. They have $1,000 per month available to spend on eating out. The price of a diner breakfast is always $10. Each labeled point represents the tangency between a budget...
3. (10 points) Income and substitution effects A consumer's utility is given by U(x, y) = xy. Income is m and prices ar...
 3. (10 points) Income and substitution effects A consumer's utility is given by U(x, y) = xy. Income is m and prices are given by p and Py (a) Find the demand functions for x and y. (b) What is demand for each good if p 2 and py 1 and income is m = (c) If price of x fell to pa 1, what is the consumer's new bundle? (d) How much of the response in the consumption of...
9. Income and substitution effects Felix and Janet Green live in Detroit and enjoy going out...
 9. Income and substitution effects
Felix and Janet Green live in Detroit and enjoy going out to
fancy restaurants for dinner and to diners for breakfast. On the
following diagram, the purple curves I1I1 and I2I2 represent two of
their indifference curves for fancy dinners and diner breakfasts.
They have $500 per month available to spend on eating out. The
price of a diner breakfast is always $5. Each labeled point
represents the tangency between a budget constraint and the...
9. Income and substitution effects
Felix and Janet Green live in Detroit and enjoy going out to
fancy restaurants for dinner and to diners for breakfast. On the
following diagram, the purple curves I1I1 and I2I2 represent two of
their indifference curves for fancy dinners and diner breakfasts.
They have $500 per month available to spend on eating out. The
price of a diner breakfast is always $5. Each labeled point
represents the tangency between a budget constraint and the...
chp.5: individual & market demand Practice Questions: Income and Substitution Effects, Deriving Market Demand 1. The...
 chp.5: individual & market demand
Practice Questions: Income and Substitution Effects, Deriving Market Demand 1. The graphs below show Josh's preferences for pancakes and cereal. In each of the price changes in cereal below, show on the graph the total effect of the price change on the consumption of cereal. Then show how much of the change is due to the income effect, and how much is due to the substitution effect. a. Initially Josh purchased bundle A. This week,...
chp.5: individual & market demand
Practice Questions: Income and Substitution Effects, Deriving Market Demand 1. The graphs below show Josh's preferences for pancakes and cereal. In each of the price changes in cereal below, show on the graph the total effect of the price change on the consumption of cereal. Then show how much of the change is due to the income effect, and how much is due to the substitution effect. a. Initially Josh purchased bundle A. This week,...
please help!! Is the sales tax progressive, regressive or flat with respect to income? 5.4 Calculate...
 please help!!
Is the sales tax progressive, regressive or flat with respect to income? 5.4 Calculate the total Consumer Surplus for the following. The following data reveals how much each consumer is willing to pay for an Alaskan cruise: Amy $9003 Edwin $2,000 Bob $1,000 George $1,300 Carol $1,500 Henry $1,800 Edwardo $4002 Irving $1,500 Raymond $1,2005 Joseph $300 Draw the market demand curve for each of these 10 consumers. If the cruise costs $1,000 how many passengers will there...
please help!!
Is the sales tax progressive, regressive or flat with respect to income? 5.4 Calculate the total Consumer Surplus for the following. The following data reveals how much each consumer is willing to pay for an Alaskan cruise: Amy $9003 Edwin $2,000 Bob $1,000 George $1,300 Carol $1,500 Henry $1,800 Edwardo $4002 Irving $1,500 Raymond $1,2005 Joseph $300 Draw the market demand curve for each of these 10 consumers. If the cruise costs $1,000 how many passengers will there...
 please be quick
NSA 75BC-45DAY. 1994 # 2 of 2 OS Ted enjoys eating both apples (A) and Peaches (P). He has $30 to spend on the two goods each week. Initially. apples cost $2 per pound and peaches cost $3 per pound Suppose the price of peaches falls to $2. Using the information from the table illustrate Tod's bedoeline, the new budget line, his 3 bundles (bundles A, B, and C), and two indifference curve sure to label everything...
please be quick
NSA 75BC-45DAY. 1994 # 2 of 2 OS Ted enjoys eating both apples (A) and Peaches (P). He has $30 to spend on the two goods each week. Initially. apples cost $2 per pound and peaches cost $3 per pound Suppose the price of peaches falls to $2. Using the information from the table illustrate Tod's bedoeline, the new budget line, his 3 bundles (bundles A, B, and C), and two indifference curve sure to label everything...
 9. Income and substitution effects Carlos and Deborah Azinian live in Detroit and enjoy going out to fancy restaurants for dinner and to diners for breakfast. On the following diagram, the purple curves 11 and 12 represent two of their indifference curves for fancy dinners and diner breakfasts. They have $1,000 per month available to spend on eating out. The price of a diner breakfast is always $10. Each labeled point represents the tangency between a budget constraint and the...
 9. Income and substitution effects Larry and Megan Stein live in Detroit and enjoy going out to fancy restaurants for dinner and to diners for breakfast. On the following diagram, the purple curves 11 and 12 represent two of their indifference curves for fancy dinners and diner breakfasts. They have $1,000 per month available to spend on eating out. The price of a diner breakfast is always $10. Each labeled point represents the tangency between a budget constraint and the...
 9. Income and substitution effects Dmitri and Frances Doherty live in Miami and enjoy going out to fancy restaurants for dinner and to diners for breakfast. On the following diagram, the purple curves 11 and 12 represent two of their indifference curves for fancy dinners and diner breakfasts. They have $1,000 per month available to spend on eating out. The price of a diner breakfast is always $10. Each labeled point represents the tangency between a budget constraint and the...
 Homework (Ch 21) 9. Income and substitution effects Andrew and Beth Trimble live in Philadelphia and enjoy going out to fancy restaurants for dinner and to diners for breakfast. On the following diagram, the purple curves I, and I, represent two of their indifference curves for fancy dinners and diner breakfasts. They have $1,000 per month available to spend on eating out. The price of a diner breakfast is always $10. Each labeled point represents the tangency between a budget...
 Homework (Ch 21) 9. Income and substitution effects Andrew and Beth Trimble live in Philadelphia and enjoy going out to fancy restaurants for dinner and to diners for breakfast. On the following diagram, the purple curves I, and I, represent two of their indifference curves for fancy dinners and diner breakfasts. They have $1,000 per month available to spend on eating out. The price of a diner breakfast is always $10. Each labeled point represents the tangency between a budget...
 3. (10 points) Income and substitution effects A consumer's utility is given by U(x, y) = xy. Income is m and prices are given by p and Py (a) Find the demand functions for x and y. (b) What is demand for each good if p 2 and py 1 and income is m = (c) If price of x fell to pa 1, what is the consumer's new bundle? (d) How much of the response in the consumption of...
 9. Income and substitution effects
Felix and Janet Green live in Detroit and enjoy going out to
fancy restaurants for dinner and to diners for breakfast. On the
following diagram, the purple curves I1I1 and I2I2 represent two of
their indifference curves for fancy dinners and diner breakfasts.
They have $500 per month available to spend on eating out. The
price of a diner breakfast is always $5. Each labeled point
represents the tangency between a budget constraint and the...
9. Income and substitution effects
Felix and Janet Green live in Detroit and enjoy going out to
fancy restaurants for dinner and to diners for breakfast. On the
following diagram, the purple curves I1I1 and I2I2 represent two of
their indifference curves for fancy dinners and diner breakfasts.
They have $500 per month available to spend on eating out. The
price of a diner breakfast is always $5. Each labeled point
represents the tangency between a budget constraint and the...
 chp.5: individual & market demand
Practice Questions: Income and Substitution Effects, Deriving Market Demand 1. The graphs below show Josh's preferences for pancakes and cereal. In each of the price changes in cereal below, show on the graph the total effect of the price change on the consumption of cereal. Then show how much of the change is due to the income effect, and how much is due to the substitution effect. a. Initially Josh purchased bundle A. This week,...
chp.5: individual & market demand
Practice Questions: Income and Substitution Effects, Deriving Market Demand 1. The graphs below show Josh's preferences for pancakes and cereal. In each of the price changes in cereal below, show on the graph the total effect of the price change on the consumption of cereal. Then show how much of the change is due to the income effect, and how much is due to the substitution effect. a. Initially Josh purchased bundle A. This week,...
 please help!!
Is the sales tax progressive, regressive or flat with respect to income? 5.4 Calculate the total Consumer Surplus for the following. The following data reveals how much each consumer is willing to pay for an Alaskan cruise: Amy $9003 Edwin $2,000 Bob $1,000 George $1,300 Carol $1,500 Henry $1,800 Edwardo $4002 Irving $1,500 Raymond $1,2005 Joseph $300 Draw the market demand curve for each of these 10 consumers. If the cruise costs $1,000 how many passengers will there...
please help!!
Is the sales tax progressive, regressive or flat with respect to income? 5.4 Calculate the total Consumer Surplus for the following. The following data reveals how much each consumer is willing to pay for an Alaskan cruise: Amy $9003 Edwin $2,000 Bob $1,000 George $1,300 Carol $1,500 Henry $1,800 Edwardo $4002 Irving $1,500 Raymond $1,2005 Joseph $300 Draw the market demand curve for each of these 10 consumers. If the cruise costs $1,000 how many passengers will there...
Most questions answered within 3 hours.
-
Develop in C language the function whose prototype is described
below. Please, send the entire code,...
asked 14 minutes ago -
What single payment today would replace a payment stream of
$50,000 that will be paid today,...
asked 7 minutes ago -
please c++ with functions *Modify the Guessing Game Write the
secret number to a file. Then...
asked 8 minutes ago -
Question about ACID/BASE. Equal volumes of 0.230 M weak base (Kb
= 4.0× 10⁻⁹) and 0.230...
asked 13 minutes ago -
The charges and coordinates of two charged particles held fixed
in an xy plane are q1...
asked 15 minutes ago -
A particle of mass M = 7.5 kg is at a position r = (-3 i...
asked 15 minutes ago -
Please answer the question below with complete explanation and a
light rays drawing of the concave...
asked 18 minutes ago -
On January 4th, Stevens Manufacturing received an
order for 30 uniforms. The following information pertained to...
asked 27 minutes ago -
what is the present value of a 3 year growing annuity with the
first payment of...
asked 34 minutes ago -
The thermochemical equation for the combustion of sulfur dioxide
is shown below.
2 S02(g) + O2...
asked 1 hour ago -
What is the name of the pathogen that causes leaf spot on
Tecoma stans?
asked 52 minutes ago -
What criminal penalties might an individual face for violating
securities laws? Do you believe these penalties...
asked 1 hour ago