Hello tutor, could you solve part e of this question for me ASAP
thank you.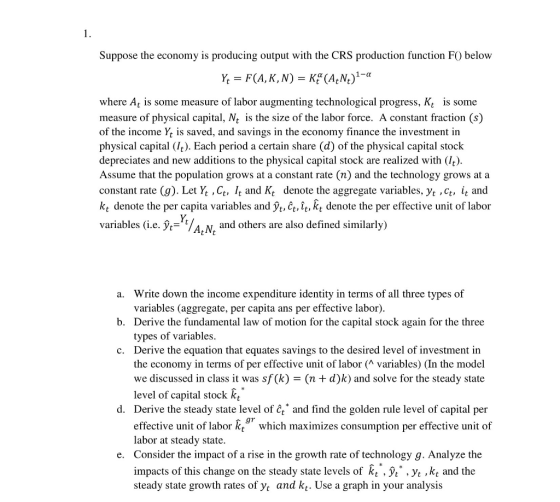
Homework Answers

Add Answer to:
Hello tutor, could you solve part e of this question for me
ASAP
thank you.
Suppose...
Consider the Solow growth model. Output at time t is given by the production function Yt...
Consider the Solow growth model. Output at time t is given by the production function Yt = AK 1 3 t L 2 3 where Kt is total capital at time t, L is the labour force and A is total factor productivity. The labour force and total factor productivity are constant over time and capital evolves according the transition equation Kt+1 = (1 − d) ∗ Kt + It , where d is the depreciation rate. Every person saves...
MALTHUS AND SOLOW GROWTH MODEL
Malthusian Model of Growth Notation: Yt Aggregate output; Nt Population size; L¯ Land (fixed); ct Per capita consumption Production: Aggregate production function is Yt = F(Nt , Lt) = zN2/3 t L 1/3 t Population Dynamics: Nt+1 = g(ct)Nt Population growth function: g(ct) = (3ct) 1/3 Parameter Values: Land: L¯ = 1000 for all t. Productivity parameter: z = 1 ...
MALTHUSIAN MODEL
 Notation: Yt Aggregate output; Nt Population size; L¯ Land (fixed); ct Per capita consumptionAggregate production function is Yt = F(Nt
, Lt) = zN2/3
t L
1/3
t
Population Dynamics: Nt+1 = g(ct)Nt
Population growth function: g(ct) = (3ct)
1/3
Parameter Values: Land: L¯ = 1000 for all t. Productivity parameter: z = 1
(a) Solve for the steady state of this economy (Steady state: Nt+1 = Nt). Report steady
state values for c and N.
(b) Suppose the economy...
Notation: Yt Aggregate output; Nt Population size; L¯ Land (fixed); ct Per capita consumptionAggregate production function is Yt = F(Nt
, Lt) = zN2/3
t L
1/3
t
Population Dynamics: Nt+1 = g(ct)Nt
Population growth function: g(ct) = (3ct)
1/3
Parameter Values: Land: L¯ = 1000 for all t. Productivity parameter: z = 1
(a) Solve for the steady state of this economy (Steady state: Nt+1 = Nt). Report steady
state values for c and N.
(b) Suppose the economy...
1. Solow growth model: a. Draw the steady-state equilibrium by drawing the savings line and the...
 1. Solow growth model: a. Draw the steady-state equilibrium by drawing the savings line and the investment line. Show the steady-state values of savings, investment and capital per worker. b. On the same graph, also draw the output per worker (or per-worker production function) line. At the steady-state, mark the level of consumption per worker and savings per worker. c. What is the growth rate of yt, Ct, kt (per-worker variables, represented with an "upperbar" in class) in the steady-state?...
3. Transition Dynamics Consider the Solow growth model with constant population and no techno- logical progress...
 3. Transition Dynamics Consider the Solow growth model with constant population and no techno- logical progress as studied in class. Suppose the economy is initially in the steady state, with the level of per-capita capital stock of kss. The per-capita production function is given by y -f (k) - Akt, 0 < α < 1. In each of the following scenarios, plot the transition time path of per capita capital stock. kt, per-capita output, yt, and per-capita consumption, ct- (1-s...
Consider an economy such that Capital per effective worker: kt Output per effective worker: yt =...
 Consider an economy such that Capital per effective worker: kt Output per effective worker: yt = 2k0:5 Depreciation rate: 8 = 0.16 Saving rate: s= 0.3 Workforce growth rate: &N = 0.2 Technology growth rate: gA = 0.2 Evolution of capital per effective worker : kt+1 - kt = >> 1 _ syt-(6+8N+gA+SNSA)kt 1+gN+SA+SNSA In the steady state, capital per effective worker does not change over time. Let k* denote the steady state level of capital per effective worker. •...
Solow growth model: 1. a. Draw the steady-state equilibrium by drawing the savings line and the...
 Solow growth model: 1. a. Draw the steady-state equilibrium by drawing the savings line and the investment line. Show the steady-state values of savings, investment and capital per worker. b. On the same graph, also draw the output per worker (or per-worker production function) line. At the steady-state, mark the level of consumption per worker and savings per worker. c. What is the growth rate of yYt, Ct, kt (per-worker variables, represented with an "upperbar" in class) in the steady-state?...
Consider an economy such that Output per worker: yt = 2k£.5 Capital per worker: kt Saving...
 Consider an economy such that Output per worker: yt = 2k£.5 Capital per worker: kt Saving rate: s = 0.2 Depreciation rate: 8 = 0.15 Workforce growth rate: gN = 0.25 sy-(8+g)k¢ Evolution of capital per worker: kt+1- kt = 1+gN In the steady state, capital per worker does not change over time. Let k* denote the steady state level of capital per worker In the steady state, capital per worker is а) 8 b) 4 c) 2 d) 1...
Question 3 : Solow model with long-run TFP growth [20 marks] Suppose output is given by...
 Question 3 : Solow model with long-run TFP growth [20 marks] Suppose output is given by Y = K}(AN) As in the basic model, the workforce grows at rate n, capital depreciates at rate d and the savings rate is s. In addition, suppose that TFP grows at a constant rate g. That is: ΔΑ A9 We will refer to the product AN as the "effective workforce". It follows that the effective workforce grows at rate n+g. a. Express the...
Consider the Solow growth model. Output at time t is given by the production function Y-AK3...
 Consider the Solow growth model. Output at time t is given by the production function Y-AK3 Lš where K, is total capital at time t, L is the labour force and A is total factor productivity. The labour force and total factor productivity are constant over time and capital evolves according the transition equation KH = (1-d) * Kit It: where d is the depreciation rate. Every person saves share s of his income and, therefore, aggregate saving is St-s...
 1. Solow growth model: a. Draw the steady-state equilibrium by drawing the savings line and the investment line. Show the steady-state values of savings, investment and capital per worker. b. On the same graph, also draw the output per worker (or per-worker production function) line. At the steady-state, mark the level of consumption per worker and savings per worker. c. What is the growth rate of yt, Ct, kt (per-worker variables, represented with an "upperbar" in class) in the steady-state?...
 3. Transition Dynamics Consider the Solow growth model with constant population and no techno- logical progress as studied in class. Suppose the economy is initially in the steady state, with the level of per-capita capital stock of kss. The per-capita production function is given by y -f (k) - Akt, 0 < α < 1. In each of the following scenarios, plot the transition time path of per capita capital stock. kt, per-capita output, yt, and per-capita consumption, ct- (1-s...
 Consider an economy such that Capital per effective worker: kt Output per effective worker: yt = 2k0:5 Depreciation rate: 8 = 0.16 Saving rate: s= 0.3 Workforce growth rate: &N = 0.2 Technology growth rate: gA = 0.2 Evolution of capital per effective worker : kt+1 - kt = >> 1 _ syt-(6+8N+gA+SNSA)kt 1+gN+SA+SNSA In the steady state, capital per effective worker does not change over time. Let k* denote the steady state level of capital per effective worker. •...
 Solow growth model: 1. a. Draw the steady-state equilibrium by drawing the savings line and the investment line. Show the steady-state values of savings, investment and capital per worker. b. On the same graph, also draw the output per worker (or per-worker production function) line. At the steady-state, mark the level of consumption per worker and savings per worker. c. What is the growth rate of yYt, Ct, kt (per-worker variables, represented with an "upperbar" in class) in the steady-state?...
 Consider an economy such that Output per worker: yt = 2k£.5 Capital per worker: kt Saving rate: s = 0.2 Depreciation rate: 8 = 0.15 Workforce growth rate: gN = 0.25 sy-(8+g)k¢ Evolution of capital per worker: kt+1- kt = 1+gN In the steady state, capital per worker does not change over time. Let k* denote the steady state level of capital per worker In the steady state, capital per worker is а) 8 b) 4 c) 2 d) 1...
 Question 3 : Solow model with long-run TFP growth [20 marks] Suppose output is given by Y = K}(AN) As in the basic model, the workforce grows at rate n, capital depreciates at rate d and the savings rate is s. In addition, suppose that TFP grows at a constant rate g. That is: ΔΑ A9 We will refer to the product AN as the "effective workforce". It follows that the effective workforce grows at rate n+g. a. Express the...
 Consider the Solow growth model. Output at time t is given by the production function Y-AK3 Lš where K, is total capital at time t, L is the labour force and A is total factor productivity. The labour force and total factor productivity are constant over time and capital evolves according the transition equation KH = (1-d) * Kit It: where d is the depreciation rate. Every person saves share s of his income and, therefore, aggregate saving is St-s...
Most questions answered within 3 hours.
-
A perfect gas undergoes an isentropic process such that its
volume doubles. If the ratio of...
asked 7 minutes ago -
list the elements in groups 3A to 6A in the same order as in the
periodic...
asked 16 minutes ago -
Estimating effect size. Peng and Chen (2014)
evaluated effect size estimates for various tests. In their...
asked 26 minutes ago -
Write a script in MySQL that creates and calls a stored
procedure name test. This procedure...
asked 26 minutes ago -
If we test the following: H0: μ = 17
vs. H1: μ ≠ 17 and the...
asked 37 minutes ago -
in the past year TVG had revenues of 3 million, cost
of goods sold of $25...
asked 43 minutes ago -
4) In a polypeptide, which bond cannot rotate because of its
partial double bond character?
The...
asked 1 hour ago -
Assume that in the short run L = 1,000 and K = 100. 1. What is...
asked 1 hour ago -
At a given temperature, 2.06 atm of H2 and 3.7 atm of Br2 are
mixed and...
asked 1 hour ago -
Sodium reacts with Hydrochloric acid to form sodium chloride and
hydrogen gas. 2Na(s)+ 2 HCl(aq)-> 2...
asked 1 hour ago -
The following circuits (1 & 2) are combined to form a
series-parallel circuit and resulting circuit...
asked 1 hour ago -
Feynman's use of path integrals can make some of the transition
from quantum scale to real...
asked 1 hour ago