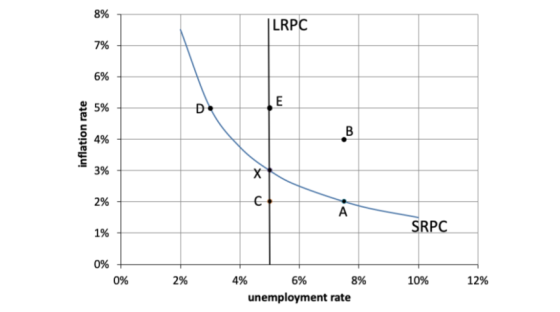
14. Suppose that the economy is at point A on the Phillips curve graph above. Starting at that point, what two fiscal policy options would help to improve national economic conditions?
15. If the government pursued the fiscal policy options you identified in #14, what would happen to the federal government’s budget deficit? Check one answer:
⧠ the deficit would grow larger (more negative)
⧠ the deficit would become smaller (less negative)
16. If the government pursued the fiscal policy options you identified in #14, starting at point A, which point on the Phillips curve graph could the economy move to in the short run? (Hint: think about what the AS - AD model would tell you about the effects of those fiscal policy options, and then translate those predictions into the Phillips curve model to answer this question.) Check one answer:
⧠ X ⧠ B ⧠ C ⧠ D ⧠ E
Homework Answers

Add Answer to:
14. Suppose that the economy is at point A on the Phillips curve
graph above. Starting...
4. The costs of inflation and of combating inflation The following graph shows a short-run Phillips...
 4. The costs of inflation and of combating inflation The following graph shows a short-run Phillips curve for a hypothetical economy. Show the short-run effect of a contractionary monetary policy by dragging the point along the short-run Phillips curve (SRPC) or shifting the curve to the appropriate position. ? 12 11 10 SRPC 8 4 SRPC 3 2 1 0 1 4 5 UNEMPLOYMENT (Percent) INFLATION RATE Percent) Now, show the long-run effect of a contractionary monetary policy by dragging...
The economy stays for a few years at point E, and people come to expect that...
 The economy stays for a few years at point E, and people come to
expect that the inflation rate will stay at that level in the
future. But then the Fed decides that the inflation rate is too
high, so it unexpectedly adopts a tight money policy to reduce the
inflation rate.
6. At this point in the story, the economy is no longer at a
point on the same short-run Phillips curve that it started on. What
does the...
The economy stays for a few years at point E, and people come to
expect that the inflation rate will stay at that level in the
future. But then the Fed decides that the inflation rate is too
high, so it unexpectedly adopts a tight money policy to reduce the
inflation rate.
6. At this point in the story, the economy is no longer at a
point on the same short-run Phillips curve that it started on. What
does the...
Suppose the economy is in a long-run equilibrium, as shown on the following graph. Now suppose...
 Suppose the economy is in a long-run equilibrium, as shown on the following graph. Now suppose a wave of business pessimism reduces aggregate demand. On the following graph, shirt a curve or adjust the point to reflect the short-run effect of business pessimism. LRPC Inflation Rate SRPC Unemployment Rate If the Fed undertakes expansionary monetary policy, it return the economy to its original inflation rate and original unemployment rate. Now, suppose the economy is back in long-run equilibrium, and then...
Suppose that the Mexican economy is described in the following graph: Economy is currently at point...
 Suppose that the Mexican economy is described in the following
graph:
Economy is currently at point A; develop an appropriate fiscal
policy to restore the natural rate of output. Outline the effect of
government’s policy on AD and AS curve.
LRAS SRAS AD
Suppose that the Mexican economy is described in the following
graph:
Economy is currently at point A; develop an appropriate fiscal
policy to restore the natural rate of output. Outline the effect of
government’s policy on AD and AS curve.
LRAS SRAS AD
4. Suppose that the Mexican economy is described in the following graph: a. Economy is currently...
4. Suppose that the Mexican economy is described in the following graph: a. Economy is currently at point A; develop an appropriate fiscal policy to restore the natural rate of output. Outline the effect of government’s policy on AD and AS curve. (6 points). LRAS SRAS AD
ECON 1150
In the year 2023, aggregate demand and aggregate supply in the fictional country of Gurder are represented by the curves AD2023AD2023 and AS on the following graph.Suppose the natural rate of output in this economy is $6 trillion.On the following graph, use the green line (triangle symbol) to plot the long-run aggregate-supply (LRAS) curve for this economy.LRASOutcome C0246810121416108107106105104103102101100PRICE LEVELOUTPUT (Trillions of dollars)ADAADBAD2023ABASEconomists have forecast that if the government does nothing and the economy continues to grow at the current rate, aggregate demand...
Please box answers! Thank you. 11. Monetary policy and the LM curve Aa Aa The following graph shows the demand and supply of real money balances in a hypothetical economy. Use the black point (X point...
 Please box answers! Thank
you.
11. Monetary policy and the LM curve Aa Aa The following graph shows the demand and supply of real money balances in a hypothetical economy. Use the black point (X point) to indicate the equilibrium in this market. Dashed drop lines will automatically extend to both axes. REAL INTEREST RATE [Percent) 10 Equilibrium Supply New Supply New Equilibrium Demand 3 0 10 20 30 40 50 60 70 80 90 100 REAL MONEY BALANCES Help...
Please box answers! Thank
you.
11. Monetary policy and the LM curve Aa Aa The following graph shows the demand and supply of real money balances in a hypothetical economy. Use the black point (X point) to indicate the equilibrium in this market. Dashed drop lines will automatically extend to both axes. REAL INTEREST RATE [Percent) 10 Equilibrium Supply New Supply New Equilibrium Demand 3 0 10 20 30 40 50 60 70 80 90 100 REAL MONEY BALANCES Help...
1. Is the Phillips curve a myth? Intertemporal tradeoff between inflation and unemployment After the World...
 1. Is the Phillips curve a myth? Intertemporal tradeoff between inflation and unemployment After the World War II, empirical economists noticed that, in many advanced economies, as unemployment fell, inflation tended to rise, and vice versa. The inverse relationship between unemployment and Inflation, was depicted as the Phillips curve, after William Phillips of the London School of Economics. In the 1950s and 1960s, the Phillips curve convinced many policy makers that they could use the relationship to pick acceptable levels...
The graph shows an economy that is above full employment. To restore full employment, the government...
 The graph shows an economy that is above full employment. To restore full employment, the government decreases government expenditure by $0.5 trillion. Draw a curve to show the effect of the decrease if this is the only change in spending plans. Label the curve AD0-ΔE The decrease in government expenditure sets off a multiplier process. Draw a curve that shows the multiplier effect that returns the economy to full employment. Label it AD Draw a point at the full-employment equilibrium...
 4. The costs of inflation and of combating inflation The following graph shows a short-run Phillips curve for a hypothetical economy. Show the short-run effect of a contractionary monetary policy by dragging the point along the short-run Phillips curve (SRPC) or shifting the curve to the appropriate position. ? 12 11 10 SRPC 8 4 SRPC 3 2 1 0 1 4 5 UNEMPLOYMENT (Percent) INFLATION RATE Percent) Now, show the long-run effect of a contractionary monetary policy by dragging...
 4. The costs of inflation and of combating inflation The following graph shows a short-run Phillips curve for a hypothetical economy. Show the short-run effect of a contractionary monetary policy by dragging the point along the short-run Phillips curve (SRPC) or shifting the curve to the appropriate position. ? 12 11 10 SRPC 8 4 SRPC 3 2 1 0 1 4 5 UNEMPLOYMENT (Percent) INFLATION RATE Percent) Now, show the long-run effect of a contractionary monetary policy by dragging...
 The economy stays for a few years at point E, and people come to
expect that the inflation rate will stay at that level in the
future. But then the Fed decides that the inflation rate is too
high, so it unexpectedly adopts a tight money policy to reduce the
inflation rate.
6. At this point in the story, the economy is no longer at a
point on the same short-run Phillips curve that it started on. What
does the...
The economy stays for a few years at point E, and people come to
expect that the inflation rate will stay at that level in the
future. But then the Fed decides that the inflation rate is too
high, so it unexpectedly adopts a tight money policy to reduce the
inflation rate.
6. At this point in the story, the economy is no longer at a
point on the same short-run Phillips curve that it started on. What
does the...
 Suppose the economy is in a long-run equilibrium, as shown on the following graph. Now suppose a wave of business pessimism reduces aggregate demand. On the following graph, shirt a curve or adjust the point to reflect the short-run effect of business pessimism. LRPC Inflation Rate SRPC Unemployment Rate If the Fed undertakes expansionary monetary policy, it return the economy to its original inflation rate and original unemployment rate. Now, suppose the economy is back in long-run equilibrium, and then...
 Suppose that the Mexican economy is described in the following
graph:
Economy is currently at point A; develop an appropriate fiscal
policy to restore the natural rate of output. Outline the effect of
government’s policy on AD and AS curve.
LRAS SRAS AD
Suppose that the Mexican economy is described in the following
graph:
Economy is currently at point A; develop an appropriate fiscal
policy to restore the natural rate of output. Outline the effect of
government’s policy on AD and AS curve.
LRAS SRAS AD
 Please box answers! Thank
you.
11. Monetary policy and the LM curve Aa Aa The following graph shows the demand and supply of real money balances in a hypothetical economy. Use the black point (X point) to indicate the equilibrium in this market. Dashed drop lines will automatically extend to both axes. REAL INTEREST RATE [Percent) 10 Equilibrium Supply New Supply New Equilibrium Demand 3 0 10 20 30 40 50 60 70 80 90 100 REAL MONEY BALANCES Help...
Please box answers! Thank
you.
11. Monetary policy and the LM curve Aa Aa The following graph shows the demand and supply of real money balances in a hypothetical economy. Use the black point (X point) to indicate the equilibrium in this market. Dashed drop lines will automatically extend to both axes. REAL INTEREST RATE [Percent) 10 Equilibrium Supply New Supply New Equilibrium Demand 3 0 10 20 30 40 50 60 70 80 90 100 REAL MONEY BALANCES Help...
 1. Is the Phillips curve a myth? Intertemporal tradeoff between inflation and unemployment After the World War II, empirical economists noticed that, in many advanced economies, as unemployment fell, inflation tended to rise, and vice versa. The inverse relationship between unemployment and Inflation, was depicted as the Phillips curve, after William Phillips of the London School of Economics. In the 1950s and 1960s, the Phillips curve convinced many policy makers that they could use the relationship to pick acceptable levels...
 The graph shows an economy that is above full employment. To restore full employment, the government decreases government expenditure by $0.5 trillion. Draw a curve to show the effect of the decrease if this is the only change in spending plans. Label the curve AD0-ΔE The decrease in government expenditure sets off a multiplier process. Draw a curve that shows the multiplier effect that returns the economy to full employment. Label it AD Draw a point at the full-employment equilibrium...
Most questions answered within 3 hours.
-
First, describe policies promoted by governments of the
political right to address economic globalization. Second, describe...
asked 9 minutes ago -
M2-9 Completing T-Accounts LO2-4
Following are the transactions of Dennen, Inc., for the month of
January....
asked 9 minutes ago -
Write a program using python that reads from values from a text
file and plots them...
asked 10 minutes ago -
Look up the density of
the metal of the object used in parts A and B...
asked 10 minutes ago -
Discuss strategic considerations that Amazon and NYC politicians
had. Analyze why the deal between Amazon and...
asked 13 minutes ago -
A combustion reaction is describes as a carbon source reacting
with oxygen and producing carbon dioxide...
asked 28 minutes ago -
Buckminsterfullerence is a recently allotrope of carbon in which
carbon atoms form molecules of formula C_60,...
asked 30 minutes ago -
Lower Equitorial and Upper Equitorial are the same except Lower
Equitorial has a larger capital stock....
asked 35 minutes ago -
how do you think that pH of a jar where you have added a certain
amount...
asked 45 minutes ago -
If the Federal Reserve increases the reserve requirement, what
will happen to the Money Supply in...
asked 40 minutes ago -
Suppose that market demand for a good is given by Q = 9 - 0.3 P...
asked 46 minutes ago -
two thin lenses are separated by a distance x. The first lens
has a focal length...
asked 48 minutes ago