

Homework Answers
a) The value $ 343.31 is a statistic. The symbol used is

b) t* = 1.961
c) Sample standard deviation
d) For Standard deviation = $250
The 95% confidence interval is


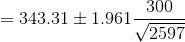
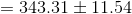
For Standard deviation = $300
The 95% confidence interval is

e) These intervals are centered at the sample mean. The interval created with larger standard deviation is wider.
Add Answer to:
A random sample of 2597 adult Americans in November 2009 revealed a sample mean of $...
please show work and/or sketch of graph. Thanks A popular online retail website was interested in...
 please show work and/or sketch of graph. Thanks
A popular online retail website was interested in consumer spending during the holiday shopping weekend after Thanksgiving. They collect data on a random sample of 400 shoppers, particularly noting how much money each shopper spent. The following histogram was constructed using the data: 50 100 200 250 300 150 Spending The retailer determines that this sample had an average of $84.71 with a standard deviation of $46.87. a. (1 point) What is...
please show work and/or sketch of graph. Thanks
A popular online retail website was interested in consumer spending during the holiday shopping weekend after Thanksgiving. They collect data on a random sample of 400 shoppers, particularly noting how much money each shopper spent. The following histogram was constructed using the data: 50 100 200 250 300 150 Spending The retailer determines that this sample had an average of $84.71 with a standard deviation of $46.87. a. (1 point) What is...
A random sample of 250 persons yields a sample mean of 110 and a sample standard...
A random sample of 250 persons yields a sample mean of 110 and a sample standard deviation of 10. Construct three different confidence intervals to estimate the population mean, using 95%, 99%, and 99.9% levels of confidence. What happens to the interval width as the confidence level increases? Why?
In a random sample of eight cell phones, the mean full retail price was $559.00 and...
 In a random sample of eight cell phones, the mean full retail price was $559.00 and the standard deviation was $226 00. Assume the population is normally distributed and use the t-distribution to find the margin of error and construct a 99% confidence interval for the population mean Interpret the results o Identify the margin of error (Round to one decimal place as needed) Construct a 99% confidence interval for the population mean IA (Round to one decimal place as...
A random sample of forty-four 200-meter swims has a mean time of 3.62 minutes and the...
 A random sample of forty-four 200-meter swims has a mean time of 3.62 minutes and the population standard deviation is 0.09 minutes. Construct a 90% confidence interval for the population mean time. Interpret the results. The 90% confidence interval is OD (Round to two decimal places as needed.) Interpret the results. Choose the correct answer below A. B. c. With 90% confidence, it can be said that the population mean time is not between the endpoints of the given confidence...
You are given the sample mean and the popd tion standard deviation Use this information to...
 You are given the sample mean and the popd tion standard deviation Use this information to con truct the 90% and 95% cor lidence intervall th interval From a random sample of 43 business days, the mean closing price of a certain stock was $117.42 Assume the population standard deviation is $10 The 90% confidence interval is Round to two decimal places as 0 Enter your answer in the edit fields and then click Check Answer Clear All remaining Type...
You are given the sample mean and the population standard deviation. Use this information to construct...
You are given the sample mean and the population standard deviation. Use this information to construct the 90% and 95% confidence intervals for the population mean. Interpret the results and compare the widths of the confidence intervals. If convenient, use technology to construct the confidence intervals. A random sample of 45 home theater systems has a mean price of $127.00. Assume the population standard deviation is $19.20. Construct a 90% confidence interval for the population mean. The 90% confidence interval...
The mean and standard deviation of a random sample of n measurements are equal to 34.1...
The mean and standard deviation of a random sample of n measurements are equal to 34.1 and 3.5, respectively. a. Find a 90% confidence interval for mu if nequals64. b. Find a 90% confidence interval for mu if nequals256. c. Find the widths of the confidence intervals found in parts a and b. What is the effect on the width of a confidence interval of quadrupling the sample size while holding the confidence coefficient fixed?
You are given the sample mean and the population standard deviation. Use this information to construct...
You are given the sample mean and the population standard deviation. Use this information to construct the 90% and 95% confidence intervals for the population mean. Interpret the results and compare the widths of the confidence intervals. If convenient, use technology to construct the confidence intervals. A random sample of 60 home theater systems has a mean price of $135.00 . Assume the population standard deviation is $15.90 . A.) the 90% confidence interval is B.) the 95% confidence interval...
26. Birth Weights A simple random sample of birth weights in the United States has a mean of 3433...
 *without using interval functions on calculator*
26. Birth Weights A simple random sample of birth weights in the United States has a mean of 3433 g. The standard deviation of all birth weights is 495 g a. Using a sample size of 75, construct a 95% confidence interval estimate of the mean birth weight in the United States. b. Using a sample size of75,000, construct a 95% confidence interval estimate of the mean birth weight in the United States. c....
*without using interval functions on calculator*
26. Birth Weights A simple random sample of birth weights in the United States has a mean of 3433 g. The standard deviation of all birth weights is 495 g a. Using a sample size of 75, construct a 95% confidence interval estimate of the mean birth weight in the United States. b. Using a sample size of75,000, construct a 95% confidence interval estimate of the mean birth weight in the United States. c....
The mean and standard deviation of a random sample of n measurements are equal to 34.2...
 The mean and standard deviation of a random sample of n measurements are equal to 34.2 and 3.2, respectively. a. Find a 99% confidence interval for μ if n-64 b. Find a 99% confidence interval for μ if n-256 c. Find the widths of the confidence intervals found in parts a and b. What is the effect on the width of a confidence interval of quadrupling the sample size while holding the confidence coefficient fixed?
 please show work and/or sketch of graph. Thanks
A popular online retail website was interested in consumer spending during the holiday shopping weekend after Thanksgiving. They collect data on a random sample of 400 shoppers, particularly noting how much money each shopper spent. The following histogram was constructed using the data: 50 100 200 250 300 150 Spending The retailer determines that this sample had an average of $84.71 with a standard deviation of $46.87. a. (1 point) What is...
please show work and/or sketch of graph. Thanks
A popular online retail website was interested in consumer spending during the holiday shopping weekend after Thanksgiving. They collect data on a random sample of 400 shoppers, particularly noting how much money each shopper spent. The following histogram was constructed using the data: 50 100 200 250 300 150 Spending The retailer determines that this sample had an average of $84.71 with a standard deviation of $46.87. a. (1 point) What is...
 In a random sample of eight cell phones, the mean full retail price was $559.00 and the standard deviation was $226 00. Assume the population is normally distributed and use the t-distribution to find the margin of error and construct a 99% confidence interval for the population mean Interpret the results o Identify the margin of error (Round to one decimal place as needed) Construct a 99% confidence interval for the population mean IA (Round to one decimal place as...
 A random sample of forty-four 200-meter swims has a mean time of 3.62 minutes and the population standard deviation is 0.09 minutes. Construct a 90% confidence interval for the population mean time. Interpret the results. The 90% confidence interval is OD (Round to two decimal places as needed.) Interpret the results. Choose the correct answer below A. B. c. With 90% confidence, it can be said that the population mean time is not between the endpoints of the given confidence...
 You are given the sample mean and the popd tion standard deviation Use this information to con truct the 90% and 95% cor lidence intervall th interval From a random sample of 43 business days, the mean closing price of a certain stock was $117.42 Assume the population standard deviation is $10 The 90% confidence interval is Round to two decimal places as 0 Enter your answer in the edit fields and then click Check Answer Clear All remaining Type...
 *without using interval functions on calculator*
26. Birth Weights A simple random sample of birth weights in the United States has a mean of 3433 g. The standard deviation of all birth weights is 495 g a. Using a sample size of 75, construct a 95% confidence interval estimate of the mean birth weight in the United States. b. Using a sample size of75,000, construct a 95% confidence interval estimate of the mean birth weight in the United States. c....
*without using interval functions on calculator*
26. Birth Weights A simple random sample of birth weights in the United States has a mean of 3433 g. The standard deviation of all birth weights is 495 g a. Using a sample size of 75, construct a 95% confidence interval estimate of the mean birth weight in the United States. b. Using a sample size of75,000, construct a 95% confidence interval estimate of the mean birth weight in the United States. c....
 The mean and standard deviation of a random sample of n measurements are equal to 34.2 and 3.2, respectively. a. Find a 99% confidence interval for μ if n-64 b. Find a 99% confidence interval for μ if n-256 c. Find the widths of the confidence intervals found in parts a and b. What is the effect on the width of a confidence interval of quadrupling the sample size while holding the confidence coefficient fixed?
Most questions answered within 3 hours.
-
A dragon biologist is setting up an experimental population of
1000 individuals. In dragons, pointy crests...
asked 4 minutes ago -
A uniform thin rod of length 0.851 m is hung from a horizontal
nail passing through...
asked 14 minutes ago -
A 747 has a cruising speed of 235 m/s at a height of 10,700
meters. The...
asked 22 minutes ago -
Part 3: Arrows
Write a python program that prompts the user for a number of
columns,...
asked 30 minutes ago -
Need help answering these questions!!
1. What economic concept do you find most interesting in
Macroeconomics?...
asked 34 minutes ago -
1. Nimbus, Inc. produces and sells brooms. This table shows the
relationship between the number of...
asked 38 minutes ago -
A gas occupies 200. mL in a piston. If the pressure of the
piston were decreased...
asked 54 minutes ago -
A fossil is found to have a 14C level of 71.0% compared to
living organisms. How...
asked 58 minutes ago -
Many communist or socialist countries have a department that
addresses public health as well as the...
asked 1 hour ago -
the following questions are either true or false answers
1. The Central Limit Theorem allows one...
asked 1 hour ago -
The patient recovery time from a particular surgical procedure
is normally distributed with a mean of...
asked 1 hour ago -
Human relations refer to the way a company arranges people,
jobs, and communications so that work...
asked 1 hour ago