


Homework Answers
a). The monopoly pricing is where the marginal cost equals the marginal revenue of the firm, this is where the profit are maximized.
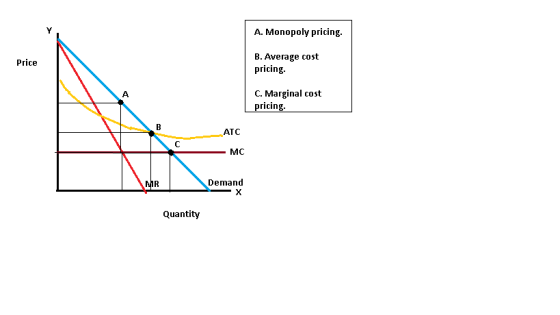
c). If the price equals the marginal cost , the firm would incur a loss and in the long run the firm may shutdown the production and this is not good for the society.
Ans: Under the marginal pricing rule , the firm would earn negative economic profits forcing them to into bankruptcy.
d). If the price equals the average total cost the firm is break even that is the total revenue equals the total cost. This would create much more efficiency than the marginal cost pricing and here the firm has got an incentive to produce.
e).
Ans: Under the average cost pricing, the firm's price would likely to remain steady over time , fixed at the average cost.
e).
Add Answer to:
The graph below depicts the cost curves of ABC Water and Heat. ABC has a natural...
119 - BADRUDOVA Activities and Due Dates > HWS The graph below depicts the cost curves...
 119 - BADRUDOVA Activities and Due Dates > HWS The graph below depicts the cost curves of ABC Water and Heat. ABC has a natural monopoly in natural gas delivery in its immediate area MMOTUS Pris a. Place the point labelled "Monopoly pricing at the appropriate coordinates to indicate the monopoly price and quantity b. Suppose the overnment tries to achieve allocative efficiency PHMC) by imposing a marginal cost pricing rule, requiring the monopolist to sell price alto marginal cost....
Consider the local telephone company, a natural monopoly. The following graph shows the demand curve for...
 Consider the local telephone company, a natural monopoly. The following graph shows the demand curve for phone services, the company's marginal revenue curve (labeled MR), Its marginal cost curve (labeled MC), and its average total cost curve (labeled ATC). You can hover over the points on the graph to see their exact coordinates. PRICE (Dollars per month) 200 180 ATC 160 140 120 100 Demand 80 60 40 MC 20 MR - 0 6 12 18 24 30 36 42...
Consider the local telephone company, a natural monopoly. The following graph shows the demand curve for...
 Consider the local telephone company, a natural monopoly. The following graph shows the demand curve for phone services, the company's marginal revenue curve (labeled MR), its marginal cost curve (labeled MC), and its average total cost curve (labeled ATC). You can hover over the points on the graph to see their exact coordinates. PRICE, COST, MR (Dollars per month) 100 90 80 70 60 Demand 50 40 30 ATC 20 MC 10 MR 54 60 30 36 42 48 0...
The following graph shows the marginal cost (MC), marginal revenue (MR), average total cost (ATC), and...
 The following graph shows the marginal cost (MC), marginal revenue (MR), average total cost (ATC), and demand (D) for a monopolist. Suppose that this monopolist cannot price discriminate. Place the grey point (starymbol) on the graph to indicate the profit-maximizing price and quantity for this monopolist. If the monopolist is making a profitne the green rectangle (triungle symbols) to shade in the area representing its profit. On the other hand, if the monopolist is suffering a loss use the purple...
please make sure you answer all the questions, thank you 9. Regulating a natural monopoly Consider...
 please make sure you answer all the questions, thank you
9. Regulating a natural monopoly Consider the local telephone company, a natural monopoly. The following araph shows the monthly demand curve for phone services and the company's marginal revenue (MR), marginal cost (MC), and average total cost (ATC) curves 100 90 80 70 60 50 40 ATC MO 30 20 10 MRI I 20 16 18 4 6 810 12 14 2 QUANTITY (Thousands of subscriptions) PRICE (Dollars per sub...
please make sure you answer all the questions, thank you
9. Regulating a natural monopoly Consider the local telephone company, a natural monopoly. The following araph shows the monthly demand curve for phone services and the company's marginal revenue (MR), marginal cost (MC), and average total cost (ATC) curves 100 90 80 70 60 50 40 ATC MO 30 20 10 MRI I 20 16 18 4 6 810 12 14 2 QUANTITY (Thousands of subscriptions) PRICE (Dollars per sub...
3. The chart illustrates your local water comnany's natural monopoly. The diagram shows the demand curve...
 3. The chart illustrates your local water comnany's natural monopoly. The diagram shows the demand curve for water, the company's marginal revenue curve. its marginal cost curve (marginal costs are constant), and its average total cost curve. The government wants to regulate the monopolist by imposing a price ceiling. (20 points) a. Label the curves -Demand (D) Marginal Revenue (MR) Marginal Cost (MC) and Average Total cost (ATC) b. If the government does not regulate this monopolist, which price will...
The graph to the right depicts the average cost curves and the marginal cost curve for...
 The graph to the right depicts the average cost curves and the marginal cost curve for a typical firm in a competitive industry. 1.) Using the line drawing fool, draw the firm's demand curve at a market price such that the firm is breaking even. Label your curved, 2.) Using the line drawing tool, draw the firm's demand curve at a market price such that the firm is at its shutdown price. Label your curved, Carefully follow the instructions above,...
parts f, g, h, and i 3. The chart illustrates your local water company's natural monopoly....
 parts f, g, h, and i
3. The chart illustrates your local water company's natural monopoly. The diagram shows the demand curve for water, the company's marginal revenue curve, its marginal cost curve (marginal costs are constant), and its average total cost curve. The government wants to regulate the monopolist by imposing a price ceiling. (20 points) a. Label the curves - Demand (D) Marginal Revenue (MR) Marginal Cost (MC) and Average Total cost (ATC) b. If the government does...
parts f, g, h, and i
3. The chart illustrates your local water company's natural monopoly. The diagram shows the demand curve for water, the company's marginal revenue curve, its marginal cost curve (marginal costs are constant), and its average total cost curve. The government wants to regulate the monopolist by imposing a price ceiling. (20 points) a. Label the curves - Demand (D) Marginal Revenue (MR) Marginal Cost (MC) and Average Total cost (ATC) b. If the government does...
b,c,d,e (thank you) 3. The chart illustrates your local water company's natural monopoly. The diagram shows the dema...
 b,c,d,e (thank you)
3. The chart illustrates your local water company's natural monopoly. The diagram shows the demand curve for water, the company's marginal revenue curve, its marginal cost curve (marginal costs are constant), and its average total cost curve. The government wants to regulate the monopolist by imposing a price ceiling. (20 points) Label the curves -Demand (D) Marginal Revenue (MR) Marginal Cost (MC) and Average Total cost (ATC) b. If the government does not regulate this monopolist, which...
b,c,d,e (thank you)
3. The chart illustrates your local water company's natural monopoly. The diagram shows the demand curve for water, the company's marginal revenue curve, its marginal cost curve (marginal costs are constant), and its average total cost curve. The government wants to regulate the monopolist by imposing a price ceiling. (20 points) Label the curves -Demand (D) Marginal Revenue (MR) Marginal Cost (MC) and Average Total cost (ATC) b. If the government does not regulate this monopolist, which...
The graph on the right shows the demand, marginal revenue, marginal cost, and average total cost...
 The graph on the right shows the demand, marginal revenue, marginal cost, and average total cost curves for a monopolist. Show the impact if this firm was regulated to charge the fair-returns price? On graph 2: 1.) Using the point drawing tool, place a point at the output and price combination that would result from regulation if the monopoly was required to charge the fair-returns price. 2.) Using the triangle drawing tool, indicate the deadweight loss that would result from...
 119 - BADRUDOVA Activities and Due Dates > HWS The graph below depicts the cost curves of ABC Water and Heat. ABC has a natural monopoly in natural gas delivery in its immediate area MMOTUS Pris a. Place the point labelled "Monopoly pricing at the appropriate coordinates to indicate the monopoly price and quantity b. Suppose the overnment tries to achieve allocative efficiency PHMC) by imposing a marginal cost pricing rule, requiring the monopolist to sell price alto marginal cost....
 Consider the local telephone company, a natural monopoly. The following graph shows the demand curve for phone services, the company's marginal revenue curve (labeled MR), Its marginal cost curve (labeled MC), and its average total cost curve (labeled ATC). You can hover over the points on the graph to see their exact coordinates. PRICE (Dollars per month) 200 180 ATC 160 140 120 100 Demand 80 60 40 MC 20 MR - 0 6 12 18 24 30 36 42...
 Consider the local telephone company, a natural monopoly. The following graph shows the demand curve for phone services, the company's marginal revenue curve (labeled MR), its marginal cost curve (labeled MC), and its average total cost curve (labeled ATC). You can hover over the points on the graph to see their exact coordinates. PRICE, COST, MR (Dollars per month) 100 90 80 70 60 Demand 50 40 30 ATC 20 MC 10 MR 54 60 30 36 42 48 0...
 The following graph shows the marginal cost (MC), marginal revenue (MR), average total cost (ATC), and demand (D) for a monopolist. Suppose that this monopolist cannot price discriminate. Place the grey point (starymbol) on the graph to indicate the profit-maximizing price and quantity for this monopolist. If the monopolist is making a profitne the green rectangle (triungle symbols) to shade in the area representing its profit. On the other hand, if the monopolist is suffering a loss use the purple...
 please make sure you answer all the questions, thank you
9. Regulating a natural monopoly Consider the local telephone company, a natural monopoly. The following araph shows the monthly demand curve for phone services and the company's marginal revenue (MR), marginal cost (MC), and average total cost (ATC) curves 100 90 80 70 60 50 40 ATC MO 30 20 10 MRI I 20 16 18 4 6 810 12 14 2 QUANTITY (Thousands of subscriptions) PRICE (Dollars per sub...
please make sure you answer all the questions, thank you
9. Regulating a natural monopoly Consider the local telephone company, a natural monopoly. The following araph shows the monthly demand curve for phone services and the company's marginal revenue (MR), marginal cost (MC), and average total cost (ATC) curves 100 90 80 70 60 50 40 ATC MO 30 20 10 MRI I 20 16 18 4 6 810 12 14 2 QUANTITY (Thousands of subscriptions) PRICE (Dollars per sub...
 3. The chart illustrates your local water comnany's natural monopoly. The diagram shows the demand curve for water, the company's marginal revenue curve. its marginal cost curve (marginal costs are constant), and its average total cost curve. The government wants to regulate the monopolist by imposing a price ceiling. (20 points) a. Label the curves -Demand (D) Marginal Revenue (MR) Marginal Cost (MC) and Average Total cost (ATC) b. If the government does not regulate this monopolist, which price will...
 The graph to the right depicts the average cost curves and the marginal cost curve for a typical firm in a competitive industry. 1.) Using the line drawing fool, draw the firm's demand curve at a market price such that the firm is breaking even. Label your curved, 2.) Using the line drawing tool, draw the firm's demand curve at a market price such that the firm is at its shutdown price. Label your curved, Carefully follow the instructions above,...
 parts f, g, h, and i
3. The chart illustrates your local water company's natural monopoly. The diagram shows the demand curve for water, the company's marginal revenue curve, its marginal cost curve (marginal costs are constant), and its average total cost curve. The government wants to regulate the monopolist by imposing a price ceiling. (20 points) a. Label the curves - Demand (D) Marginal Revenue (MR) Marginal Cost (MC) and Average Total cost (ATC) b. If the government does...
parts f, g, h, and i
3. The chart illustrates your local water company's natural monopoly. The diagram shows the demand curve for water, the company's marginal revenue curve, its marginal cost curve (marginal costs are constant), and its average total cost curve. The government wants to regulate the monopolist by imposing a price ceiling. (20 points) a. Label the curves - Demand (D) Marginal Revenue (MR) Marginal Cost (MC) and Average Total cost (ATC) b. If the government does...
 b,c,d,e (thank you)
3. The chart illustrates your local water company's natural monopoly. The diagram shows the demand curve for water, the company's marginal revenue curve, its marginal cost curve (marginal costs are constant), and its average total cost curve. The government wants to regulate the monopolist by imposing a price ceiling. (20 points) Label the curves -Demand (D) Marginal Revenue (MR) Marginal Cost (MC) and Average Total cost (ATC) b. If the government does not regulate this monopolist, which...
b,c,d,e (thank you)
3. The chart illustrates your local water company's natural monopoly. The diagram shows the demand curve for water, the company's marginal revenue curve, its marginal cost curve (marginal costs are constant), and its average total cost curve. The government wants to regulate the monopolist by imposing a price ceiling. (20 points) Label the curves -Demand (D) Marginal Revenue (MR) Marginal Cost (MC) and Average Total cost (ATC) b. If the government does not regulate this monopolist, which...
 The graph on the right shows the demand, marginal revenue, marginal cost, and average total cost curves for a monopolist. Show the impact if this firm was regulated to charge the fair-returns price? On graph 2: 1.) Using the point drawing tool, place a point at the output and price combination that would result from regulation if the monopoly was required to charge the fair-returns price. 2.) Using the triangle drawing tool, indicate the deadweight loss that would result from...
Most questions answered within 3 hours.
-
Considering gravitational time dilation, calculate the time that
passes in Earth’s surface while 1 hour passes...
asked 17 minutes ago -
Minitab Problem: Take the Lake Hume June rainfall data and find
use the processes outlined in...
asked 1 hour ago -
X Company is trying to decide whether to continue using old
equipment to make Product A...
asked 1 hour ago -
IN PYTHON ONLY !! Program 2: Re-work
program #5 (WeeklyHours) from the previous assignment such that...
asked 1 hour ago -
The average length of time between arrivals at a turnpike
toll-booth is 26 seconds. What is...
asked 3 hours ago -
(a) A piston at 6.1 atm contains a gas that occupies a volume of
3.5 L....
asked 4 hours ago -
Please answer true or false. Words
cannot be changed or added in to make it true...
asked 4 hours ago -
An empty test tube weighs 15.923 grams. Then,
MgCl2•6H2O is added into the test tube. After...
asked 4 hours ago -
Assume memory access is 10 units of time and disk access is
10000 units of time....
asked 4 hours ago -
1. Are all good samples random?
2. Magazines often report surveys giving statistics such as “63%...
asked 5 hours ago -
Under all the various types of market structures, firms
must eventually earn some economic profits for...
asked 5 hours ago -
Consider the following fitness regime for a single locus trait
with two co-dominant alleles: w11 =...
asked 5 hours ago