
Homework Answers
a)
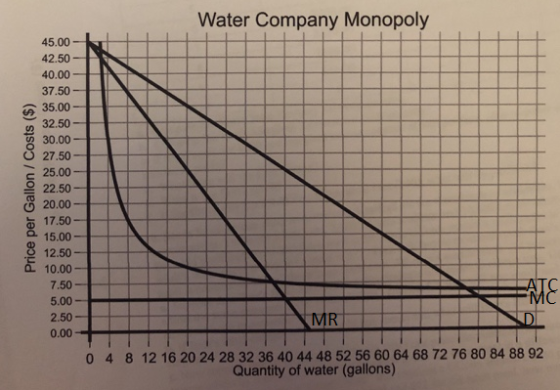
b) It will set MC=MR so the price charged = 25
c) Quantity = 40
d) Profit = P-ATC*Q = (25-7.5)*40 = 700
e) Profits = shaded region below

As per HOMEWORKLIB RULES, more than four parts are answered
Add Answer to:
3. The chart illustrates your local water comnany's natural monopoly. The diagram shows the demand curve...
b,c,d,e (thank you) 3. The chart illustrates your local water company's natural monopoly. The diagram shows the dema...
 b,c,d,e (thank you)
3. The chart illustrates your local water company's natural monopoly. The diagram shows the demand curve for water, the company's marginal revenue curve, its marginal cost curve (marginal costs are constant), and its average total cost curve. The government wants to regulate the monopolist by imposing a price ceiling. (20 points) Label the curves -Demand (D) Marginal Revenue (MR) Marginal Cost (MC) and Average Total cost (ATC) b. If the government does not regulate this monopolist, which...
b,c,d,e (thank you)
3. The chart illustrates your local water company's natural monopoly. The diagram shows the demand curve for water, the company's marginal revenue curve, its marginal cost curve (marginal costs are constant), and its average total cost curve. The government wants to regulate the monopolist by imposing a price ceiling. (20 points) Label the curves -Demand (D) Marginal Revenue (MR) Marginal Cost (MC) and Average Total cost (ATC) b. If the government does not regulate this monopolist, which...
parts f, g, h, and i 3. The chart illustrates your local water company's natural monopoly....
 parts f, g, h, and i
3. The chart illustrates your local water company's natural monopoly. The diagram shows the demand curve for water, the company's marginal revenue curve, its marginal cost curve (marginal costs are constant), and its average total cost curve. The government wants to regulate the monopolist by imposing a price ceiling. (20 points) a. Label the curves - Demand (D) Marginal Revenue (MR) Marginal Cost (MC) and Average Total cost (ATC) b. If the government does...
parts f, g, h, and i
3. The chart illustrates your local water company's natural monopoly. The diagram shows the demand curve for water, the company's marginal revenue curve, its marginal cost curve (marginal costs are constant), and its average total cost curve. The government wants to regulate the monopolist by imposing a price ceiling. (20 points) a. Label the curves - Demand (D) Marginal Revenue (MR) Marginal Cost (MC) and Average Total cost (ATC) b. If the government does...
Consider the local telephone company, a natural monopoly. The following graph shows the demand curve for...
 Consider the local telephone company, a natural monopoly. The following graph shows the demand curve for phone services, the company's marginal revenue curve (labeled MR), its marginal cost curve (labeled MC), and its average total cost curve (labeled ATC). You can hover over the points on the graph to see their exact coordinates. PRICE, COST, MR (Dollars per month) 100 90 80 70 60 Demand 50 40 30 ATC 20 MC 10 MR 54 60 30 36 42 48 0...
Consider the local telephone company, a natural monopoly. The following graph shows the demand curve for...
 Consider the local telephone company, a natural monopoly. The following graph shows the demand curve for phone services, the company's marginal revenue curve (labeled MR), Its marginal cost curve (labeled MC), and its average total cost curve (labeled ATC). You can hover over the points on the graph to see their exact coordinates. PRICE (Dollars per month) 200 180 ATC 160 140 120 100 Demand 80 60 40 MC 20 MR - 0 6 12 18 24 30 36 42...
Consider the local cable company, a natural monopoly. The following graph shows the monthly demand curve for cable services
 16. Regulating a natural monopoly Consider the local cable company, a natural monopoly. The following graph shows the monthly demand curve for cable services, the company's marginal-revenue (MR), marginal-cost (MC), and average-total-cost (ATC) curves. Suppose that the government has decided not to regulate this industry, and the firm is free to maximize profits, without constraints. Complete the first row of the following table. Suppose that the government forces the monopolist to set the price equal to marginal cost. Complete the second row of the previous...
9. Regulating a natural monopoly Consider the local cable company, a natural monopoly
 9. Regulating a natural monopoly Consider the local cable company, a natural monopoly. The following graph shows the monthly demand curve for cable services and the company's marginal revenue (MR), marginal cost (MC), and average total cost (ATC) curves. Suppose that the government has decided not to regulate this industry, and the firm is free to maximize profits, without constraints. Complete the first row of the following table. Suppose that the government forces the monopolist to set the price equal to marginal cost. Complete...
Consider the local telephone company, a natural monopoly. The following graph shows the monthly demand curve for phone services and the company's marginal revenue (MR)
 9. Regulating a natural monopoly Consider the local telephone company, a natural monopoly. The following graph shows the monthly demand curve for phone services and the company's marginal revenue (MR), marginal cost (MC), and average total cost (ATC) curves. Suppose that the government has decided not to regulate this industry, and the firm is free to maximize profits, without constraints. Complete the first row of the following table. Complete the second row of the previous table. Suppose that the government forces the monopolist to set...
Practice Question 4. The inverse demand curve a monopoly faces is p = 30 – Q....
 Practice Question 4. The inverse demand curve a monopoly faces is p = 30 – Q. The firm's total cost function is C(Q) = 0.5Q² and thus marginal cost function is MC(Q) = Q. (a) Determine the monopoly quantity, price and profit, and calculate the CS, PS and social welfare under the monopoly. (b) Determine the socially optimal outcome and calculate the CS, PS and social welfare under the social optimum. (c) Calculate the deadweight loss due to the monopolist...
8. Natural monopoly analysis The following graph shows the demand (D) for electricity services in the...
 8. Natural monopoly analysis The following graph shows the demand (D) for electricity services in the imaginary town of Utilityburg. The graph also shows the marginal revenue (MR) curve, the marginal cost (MC) curve, and the average total cost (ATC) curve for the local electricity company,a natural monopolist. On the following graph, use the black point (plus symbol) to indicate the profit-maximizing price and quantity for this natural monopolist 40 36 32 28 t 24 Monopoly Outcome a 20 t...
3. Monopoly Consider a situation where a monopolist faces the following inverse market demand curve 132...
 3. Monopoly Consider a situation where a monopolist faces the following inverse market demand curve 132 - 2a p and the following cost function TС — 12g + 2q* a) Derive the marginal revenue and marginal cost functions b) What are the equilibrium price and quantity if this market behaved as if it were competitive? c) Calculate the Consumer Surplus, Producer Surplus and Welfare levels under perfect petition d) What are the equilibrium price and quantity when the monopolist produces...
 b,c,d,e (thank you)
3. The chart illustrates your local water company's natural monopoly. The diagram shows the demand curve for water, the company's marginal revenue curve, its marginal cost curve (marginal costs are constant), and its average total cost curve. The government wants to regulate the monopolist by imposing a price ceiling. (20 points) Label the curves -Demand (D) Marginal Revenue (MR) Marginal Cost (MC) and Average Total cost (ATC) b. If the government does not regulate this monopolist, which...
b,c,d,e (thank you)
3. The chart illustrates your local water company's natural monopoly. The diagram shows the demand curve for water, the company's marginal revenue curve, its marginal cost curve (marginal costs are constant), and its average total cost curve. The government wants to regulate the monopolist by imposing a price ceiling. (20 points) Label the curves -Demand (D) Marginal Revenue (MR) Marginal Cost (MC) and Average Total cost (ATC) b. If the government does not regulate this monopolist, which...
 parts f, g, h, and i
3. The chart illustrates your local water company's natural monopoly. The diagram shows the demand curve for water, the company's marginal revenue curve, its marginal cost curve (marginal costs are constant), and its average total cost curve. The government wants to regulate the monopolist by imposing a price ceiling. (20 points) a. Label the curves - Demand (D) Marginal Revenue (MR) Marginal Cost (MC) and Average Total cost (ATC) b. If the government does...
parts f, g, h, and i
3. The chart illustrates your local water company's natural monopoly. The diagram shows the demand curve for water, the company's marginal revenue curve, its marginal cost curve (marginal costs are constant), and its average total cost curve. The government wants to regulate the monopolist by imposing a price ceiling. (20 points) a. Label the curves - Demand (D) Marginal Revenue (MR) Marginal Cost (MC) and Average Total cost (ATC) b. If the government does...
 Consider the local telephone company, a natural monopoly. The following graph shows the demand curve for phone services, the company's marginal revenue curve (labeled MR), its marginal cost curve (labeled MC), and its average total cost curve (labeled ATC). You can hover over the points on the graph to see their exact coordinates. PRICE, COST, MR (Dollars per month) 100 90 80 70 60 Demand 50 40 30 ATC 20 MC 10 MR 54 60 30 36 42 48 0...
 Consider the local telephone company, a natural monopoly. The following graph shows the demand curve for phone services, the company's marginal revenue curve (labeled MR), Its marginal cost curve (labeled MC), and its average total cost curve (labeled ATC). You can hover over the points on the graph to see their exact coordinates. PRICE (Dollars per month) 200 180 ATC 160 140 120 100 Demand 80 60 40 MC 20 MR - 0 6 12 18 24 30 36 42...
 Practice Question 4. The inverse demand curve a monopoly faces is p = 30 – Q. The firm's total cost function is C(Q) = 0.5Q² and thus marginal cost function is MC(Q) = Q. (a) Determine the monopoly quantity, price and profit, and calculate the CS, PS and social welfare under the monopoly. (b) Determine the socially optimal outcome and calculate the CS, PS and social welfare under the social optimum. (c) Calculate the deadweight loss due to the monopolist...
 8. Natural monopoly analysis The following graph shows the demand (D) for electricity services in the imaginary town of Utilityburg. The graph also shows the marginal revenue (MR) curve, the marginal cost (MC) curve, and the average total cost (ATC) curve for the local electricity company,a natural monopolist. On the following graph, use the black point (plus symbol) to indicate the profit-maximizing price and quantity for this natural monopolist 40 36 32 28 t 24 Monopoly Outcome a 20 t...
 3. Monopoly Consider a situation where a monopolist faces the following inverse market demand curve 132 - 2a p and the following cost function TС — 12g + 2q* a) Derive the marginal revenue and marginal cost functions b) What are the equilibrium price and quantity if this market behaved as if it were competitive? c) Calculate the Consumer Surplus, Producer Surplus and Welfare levels under perfect petition d) What are the equilibrium price and quantity when the monopolist produces...
Most questions answered within 3 hours.
-
For this problem, carry at least four digits after the decimal
in your calculations. Answers may...
asked 2 hours ago -
Ask a user for three positive integer numbers. Use an input
validation loop to make sure...
asked 2 hours ago -
The most primitive form of data from data analysis perspective
is a. nominal scale b. ordinal...
asked 2 hours ago -
The number of vacancies in some hypothetical metal increases by
a factor of 5 when the...
asked 2 hours ago -
The fiduciary duty that is predicated on the concept that a
board of directors and officers...
asked 2 hours ago -
Sustainable Growth Rate Last year Umbrellas Unlimited
Corporation had an ROE of 17.3% and a dividend...
asked 2 hours ago -
Write a MATLAB program to do the following:
Receive 5 input values and store them into...
asked 2 hours ago -
Which one of the following aqueous solutions would you expect to
have the largest conductance: (a)...
asked 2 hours ago -
(Intermediate Macroeconomics)
2.The aggregate supply function be ys=2000+P, and the aggregate
demand function be yD=2400-P。Find the...
asked 3 hours ago -
I am having a really difficult time developing a strong thesis
for this question....... To what...
asked 3 hours ago -
There are n street lights in a line. In order to conserve
energy, the city decides...
asked 3 hours ago -
Cellular growth and repair require a cell to go through the cell
cycle. Like all biological...
asked 3 hours ago