

Homework Answers
Add Answer to:
Problem 13-2A Ratios, common-size statements, and trend percents LO P1, P2, P3 [The following information applies...
Problem 13-2A Ratios, common-size statements, and trend percents LO P1, P2, P3 [The following information applies...
 Problem 13-2A Ratios, common-size statements, and trend percents LO P1, P2, P3 [The following information applies to the questions displayed below.] Selected comparative financial statements of Korbin Company follow KORBIN COMPANY Comparative Income Statements For Years Ended December 31, 2015, 2014, and 2013 2015 2014 Sales $ 554,143 $ 424,519 Cost of goods sold 333,594 266,173 2013 $ 294,600 188,544 Gross profit Selling expenses Administrative expenses 220,549 78,688 49,873 158,346 58,584 37,358 106,056 38,887 24,452 Total expenses 128,561 95,942 63,339...
Problem 13-2A Ratios, common-size statements, and trend percents LO P1, P2, P3 The following information applies...
 Problem 13-2A Ratios, common-size statements, and trend percents LO P1, P2, P3 The following information applies to the questions clsplayed below) Selected comparative financial statements of Korbin Company follow KORBIN COMPANY Comparative Income Statements For Years Ended December 31, 2017, 2016, and 2015 2017 2016 2015 Sales $432,442 $331,286 $229,900 Cost of goods sold 260,330 207,054 147, 136 Gross profit 172,112 124,232 82,764 Selling expenses 61, 407 45,717 30,347 Administrative expenses 38,920 29,153 19,082 Total expenses 100, 327 74,870 49,429...
Required information Problem 17-2A Ratios, common-size statements, and trend percents LO P1, P2, P3 [The following...
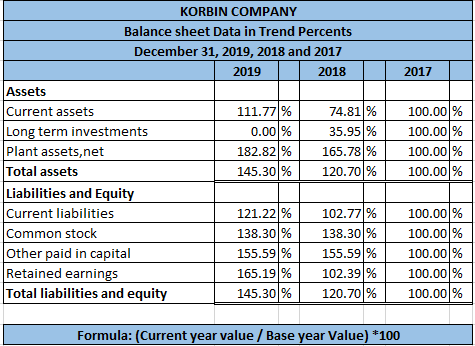
 Required information Problem 17-2A Ratios, common-size statements, and trend percents LO P1, P2, P3 [The following information applies to the questions displayed below.) Selected comparative financial statements of Korbin Company follow. KORBIN COMPANY Comparative Income Statements For Years Ended December 31, 2019, 2018, and 2017 2019 2018 2017 Sales $ 494,327 $ 378,695 $ 262,800 Cost of goods sold 297,585 238, 199168,192 Gross profit 196, 742 140,496 94,608 Selling expenses 70,194 52,260 34,690 Administrative expenses 44,489 33, 325 21,812 Total...
Problem 17-2A Ratios, common-size statements, and trend percents LO P1, P2, P3 The following information applies...
 Problem 17-2A Ratios, common-size statements, and trend percents LO P1, P2, P3 The following information applies to the questions displayed below] Selected comparative financial statements of Korbin Company follow Comparative Income Statements For Year Ended December 31, 2017 2016 $ $ 457,083 275,164 181,919 64,986 41 137 186,043 75,876 112 Cast of goods sold Gross profit Selling expenses Administrative expenses Total expenses Income before taxes Income taxes Net Income 350, 163 221 653 128.51e 48,322 30,814 79,136 49,374 10 122...
Problem 17-2A Ratios, common-size statements, and trend percents LO P1, P2, P3 [The following inf...
 Problem 17-2A Ratios, common-size statements, and trend percents LO P1, P2, P3 [The following information applies to the questions displayed below.] Selected comparative financial statements of Korbin Company follow: KORBIN COMPANY Comparative Income Statements For Years Ended December 31, 2017, 2016, and 2015 2017 2016 2015 Sales Cost of goods sold Gross profit Selling expenses Administrative expenses Total expenses Income before taxes Income taxes Net income 441,847 338,491 234,900 150,336 84,564 31,007 19,497 50,504 34,060 6,914 $ 59,704 37,943 27,146...
Part 3 of 4 Required information Problem 17-2A Ratios, common-size statements, and trend percents LO P1,...
 Part 3 of 4 Required information Problem 17-2A Ratios, common-size statements, and trend percents LO P1, P2, P3 The following information applies to the questions displayed below.) Selected comparative financial statements of Korbin Company follow. points eBook KORBIN COMPANY Comparative Income Statements For Years Ended December 31, 2019, 2018, and 2017 2019 2018 2017 Sales $414,761 $317,741 $220,500 Cost of goods sold 249,686 201,766 141, 120 Gross profit 165,075 115,975 79,380 Selling expenses 58,896 43.848 29.106 Administrative expenses 37,328 27,961...
Problem 13-2A Ratios, common-size statements, and trend percents LO P1, P2, P3 [The following information applies...
Problem 13-2A Ratios, common-size statements, and trend percents LO P1, P2, P3 [The following information applies to the questions displayed below.] Selected comparative financial statements of Korbin Company follow: KORBIN COMPANY Comparative Income Statements For Years Ended December 31, 2017, 2016, and 2015 2017 2016 2015 Sales $ 496,208 $ 380,136 $ 263,800 Cost of goods sold 298,717 237,965 168,832 Gross profit 197,491 142,171 94,968 Selling expenses 70,462 52,459 34,822 Administrative expenses 44,659 33,452 21,895 Total expenses 115,121 85,911 56,717...
Problem 13-2A Ratios, common-size statements, and trend percents LO P1, P2, P3 [The following information applies...
 Problem 13-2A Ratios, common-size statements, and trend percents LO P1, P2, P3 [The following information applies to the questions displayed below.] Selected comparative financial statements of Korbin Company follow. KORBIN COMPANY Comparative Income Statements For Years Ended December 31, 2017, 2016, and 2015 2017 2016 2015 Sales $555,000 $340,000 $278,000 Cost of goods sold 283,500 212,500 153,900 Gross profit 271,500 127,500 124,100 Selling expenses 102,900 46,920 50,800 Administrative expenses 50,668 29,920 22,800 Total expenses 153,568 76,840 73,600 Income before taxes...
Required Information Problem 13-2A Ratios, common-size statements, and trend percents LO P1, P2, P3 The following...
 Required Information Problem 13-2A Ratios, common-size statements, and trend percents LO P1, P2, P3 The following information applies to the questions displayed below.) Selected comparative financial statements of Korbin Company follow KORBIN COMPANY Comparative Income Statements For Years Ended December 31, 2017, 2016, and 2015 2017 2016 2015 Sales $ 494,327 378,695 $ 262,800 Cost of goods sold 297,585 237,820 168,192 Gross profit 196,742 148,875 94,608 Selling expenses 70,194 52,260 34,690 Administrative expenses 44,489 33,325 21,812 Total expenses 114,683 85.585...
Required Information Problem 13-2A Ratios, common-size statements, and trend percents LO P1, P2, P3 [The following...
 Required Information Problem 13-2A Ratios, common-size statements, and trend percents LO P1, P2, P3 [The following information applies to the questions displayed below.) Selected comparative financial statements of Korbin Company follow KORBIN COMPANY Comparative Income Statements For Years Ended December 31, 2017, 2016, and 2015 2017 2016 2015 $ 494,327 S 378,695 $ 262,800 Cost of goods sold 297,585 237,820 168,192 Gross profit 196,742 140,875 Selling expenses 70.194 52.26 34,690 Anistratives 44.489 21,812 Total expenses 85.585 56,582 Income before the...
 Problem 13-2A Ratios, common-size statements, and trend percents LO P1, P2, P3 [The following information applies to the questions displayed below.] Selected comparative financial statements of Korbin Company follow KORBIN COMPANY Comparative Income Statements For Years Ended December 31, 2015, 2014, and 2013 2015 2014 Sales $ 554,143 $ 424,519 Cost of goods sold 333,594 266,173 2013 $ 294,600 188,544 Gross profit Selling expenses Administrative expenses 220,549 78,688 49,873 158,346 58,584 37,358 106,056 38,887 24,452 Total expenses 128,561 95,942 63,339...
 Problem 13-2A Ratios, common-size statements, and trend percents LO P1, P2, P3 The following information applies to the questions clsplayed below) Selected comparative financial statements of Korbin Company follow KORBIN COMPANY Comparative Income Statements For Years Ended December 31, 2017, 2016, and 2015 2017 2016 2015 Sales $432,442 $331,286 $229,900 Cost of goods sold 260,330 207,054 147, 136 Gross profit 172,112 124,232 82,764 Selling expenses 61, 407 45,717 30,347 Administrative expenses 38,920 29,153 19,082 Total expenses 100, 327 74,870 49,429...
 Required information Problem 17-2A Ratios, common-size statements, and trend percents LO P1, P2, P3 [The following information applies to the questions displayed below.) Selected comparative financial statements of Korbin Company follow. KORBIN COMPANY Comparative Income Statements For Years Ended December 31, 2019, 2018, and 2017 2019 2018 2017 Sales $ 494,327 $ 378,695 $ 262,800 Cost of goods sold 297,585 238, 199168,192 Gross profit 196, 742 140,496 94,608 Selling expenses 70,194 52,260 34,690 Administrative expenses 44,489 33, 325 21,812 Total...
 Problem 17-2A Ratios, common-size statements, and trend percents LO P1, P2, P3 The following information applies to the questions displayed below] Selected comparative financial statements of Korbin Company follow Comparative Income Statements For Year Ended December 31, 2017 2016 $ $ 457,083 275,164 181,919 64,986 41 137 186,043 75,876 112 Cast of goods sold Gross profit Selling expenses Administrative expenses Total expenses Income before taxes Income taxes Net Income 350, 163 221 653 128.51e 48,322 30,814 79,136 49,374 10 122...
 Problem 17-2A Ratios, common-size statements, and trend percents LO P1, P2, P3 [The following information applies to the questions displayed below.] Selected comparative financial statements of Korbin Company follow: KORBIN COMPANY Comparative Income Statements For Years Ended December 31, 2017, 2016, and 2015 2017 2016 2015 Sales Cost of goods sold Gross profit Selling expenses Administrative expenses Total expenses Income before taxes Income taxes Net income 441,847 338,491 234,900 150,336 84,564 31,007 19,497 50,504 34,060 6,914 $ 59,704 37,943 27,146...
 Part 3 of 4 Required information Problem 17-2A Ratios, common-size statements, and trend percents LO P1, P2, P3 The following information applies to the questions displayed below.) Selected comparative financial statements of Korbin Company follow. points eBook KORBIN COMPANY Comparative Income Statements For Years Ended December 31, 2019, 2018, and 2017 2019 2018 2017 Sales $414,761 $317,741 $220,500 Cost of goods sold 249,686 201,766 141, 120 Gross profit 165,075 115,975 79,380 Selling expenses 58,896 43.848 29.106 Administrative expenses 37,328 27,961...
 Problem 13-2A Ratios, common-size statements, and trend percents LO P1, P2, P3 [The following information applies to the questions displayed below.] Selected comparative financial statements of Korbin Company follow. KORBIN COMPANY Comparative Income Statements For Years Ended December 31, 2017, 2016, and 2015 2017 2016 2015 Sales $555,000 $340,000 $278,000 Cost of goods sold 283,500 212,500 153,900 Gross profit 271,500 127,500 124,100 Selling expenses 102,900 46,920 50,800 Administrative expenses 50,668 29,920 22,800 Total expenses 153,568 76,840 73,600 Income before taxes...
 Required Information Problem 13-2A Ratios, common-size statements, and trend percents LO P1, P2, P3 The following information applies to the questions displayed below.) Selected comparative financial statements of Korbin Company follow KORBIN COMPANY Comparative Income Statements For Years Ended December 31, 2017, 2016, and 2015 2017 2016 2015 Sales $ 494,327 378,695 $ 262,800 Cost of goods sold 297,585 237,820 168,192 Gross profit 196,742 148,875 94,608 Selling expenses 70,194 52,260 34,690 Administrative expenses 44,489 33,325 21,812 Total expenses 114,683 85.585...
 Required Information Problem 13-2A Ratios, common-size statements, and trend percents LO P1, P2, P3 [The following information applies to the questions displayed below.) Selected comparative financial statements of Korbin Company follow KORBIN COMPANY Comparative Income Statements For Years Ended December 31, 2017, 2016, and 2015 2017 2016 2015 $ 494,327 S 378,695 $ 262,800 Cost of goods sold 297,585 237,820 168,192 Gross profit 196,742 140,875 Selling expenses 70.194 52.26 34,690 Anistratives 44.489 21,812 Total expenses 85.585 56,582 Income before the...
Most questions answered within 3 hours.
-
1. A boy stands on one end of a boat, and then walks to the
other...
asked 9 minutes ago -
Casey is on trial under criminal allegations that she engaged in
fraudulent behavior at the company...
asked 14 minutes ago -
Surplus Styles is a manufacturer of hair care products,
including shampoos, conditioners, and hair gels. The...
asked 12 minutes ago -
Using an income-expenditure diagram, use the infinite line and
double-drop line tools to show the economy...
asked 21 minutes ago -
Which expression computes a pseudorandom integer between -10 and
10 using rand()
from cstdlib?
A. (rand(...
asked 27 minutes ago -
Roybus, Inc., a manufacturer of flash memory, just reported that
its main production facility in Taiwan...
asked 35 minutes ago -
Two capacitors connected in parallel produce an equivalent
capacitance of 45.0 μF but when connected in...
asked 44 minutes ago -
The differences between the two sets of dependent data are -1,
2,-,2, 2. Round to the...
asked 1 hour ago -
A χ2-curve, looking at the relationship between age and hours
spent working at an office per...
asked 1 hour ago -
The pH of a sample of water from a river is 5.0. A
sample of effluent from...
asked 2 hours ago -
At the beginning of the period, the Fabricating Department
budgeted direct labor of $136,500 and equipment...
asked 2 hours ago -
Please answer all
____ 28. Rent control is usually
justified on the grounds that it protects...
asked 2 hours ago