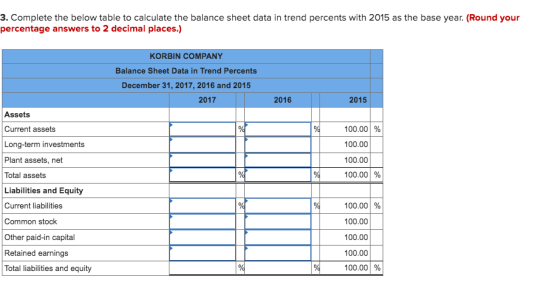
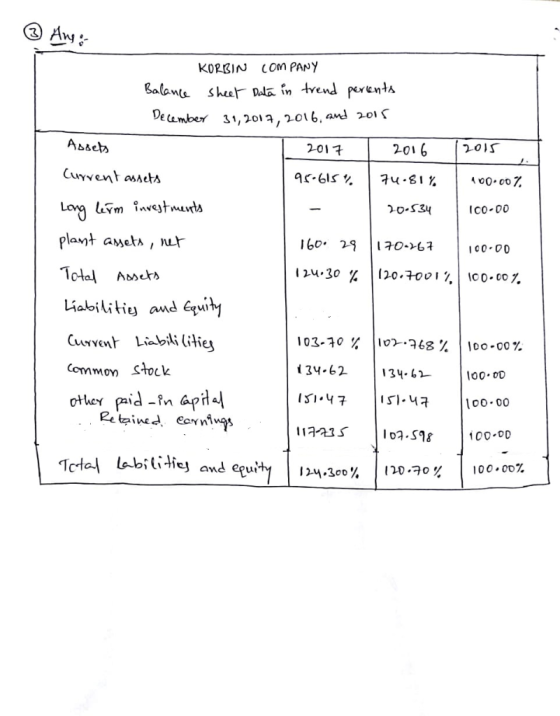
3. Complete the below table to calculate the balance sheet data in trend percents with 2015 as the base year. (Round your percentage answers to 2 decimal places.) KORBIN COMPANY Balance Sheet Data in Trend Percents December 31, 2017, 2016 and 2015 2017 2016 2015 Assets Current assets Long-term investments Plant assets, net Total assets Liabilities and Equity Current liabilities Common stock Other paid-in capital Retained earnings Total liabilities and equity 100.001 % 100.00 100.00 100.001 % 100.001 % 100.00 100.00 100.00 100.001 %
Homework Answers
Add Answer to:
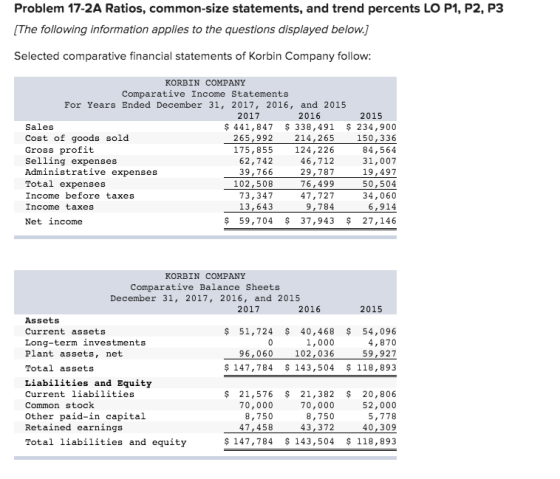
Problem 17-2A Ratios, common-size statements, and trend percents LO P1, P2, P3 [The following inf...
Problem 13-2A Ratios, common-size statements, and trend percents LO P1, P2, P3 The following information applies...
 Problem 13-2A Ratios, common-size statements, and trend percents LO P1, P2, P3 The following information applies to the questions clsplayed below) Selected comparative financial statements of Korbin Company follow KORBIN COMPANY Comparative Income Statements For Years Ended December 31, 2017, 2016, and 2015 2017 2016 2015 Sales $432,442 $331,286 $229,900 Cost of goods sold 260,330 207,054 147, 136 Gross profit 172,112 124,232 82,764 Selling expenses 61, 407 45,717 30,347 Administrative expenses 38,920 29,153 19,082 Total expenses 100, 327 74,870 49,429...
Problem 17-2A Ratios, common-size statements, and trend percents LO P1, P2, P3 The following information applies...
 Problem 17-2A Ratios, common-size statements, and trend percents LO P1, P2, P3 The following information applies to the questions displayed below] Selected comparative financial statements of Korbin Company follow Comparative Income Statements For Year Ended December 31, 2017 2016 $ $ 457,083 275,164 181,919 64,986 41 137 186,043 75,876 112 Cast of goods sold Gross profit Selling expenses Administrative expenses Total expenses Income before taxes Income taxes Net Income 350, 163 221 653 128.51e 48,322 30,814 79,136 49,374 10 122...
Problem 17-1A Ratios, common-size statements, and trend percents LO P1, P2, P3 [The following inf...
Problem 17-1A Ratios, common-size statements, and trend percents LO P1, P2, P3 [The following information applies to the questions displayed below.] Selected comparative financial statements of Korbin Company follow: KORBIN COMPANY Comparative Income Statements For Years Ended December 31, 2014, 2013, and 2012 2014 2013 2012 Sales $ 458,212 $ 351,028 $ 243,600 Cost of goods sold 275,844 221,499 155,904 Gross profit 182,368 129,529 87,696 Selling expenses 65,066 48,442 32,155 Administrative expenses 41,239 30,890 20,219 Total expenses 106,305 79,332 52,374 ...
Problem 13-2A Ratios, common-size statements, and trend percents LO P1, P2, P3 [The following information applies...
 Problem 13-2A Ratios, common-size statements, and trend percents LO P1, P2, P3 [The following information applies to the questions displayed below.] Selected comparative financial statements of Korbin Company follow KORBIN COMPANY Comparative Income Statements For Years Ended December 31, 2015, 2014, and 2013 2015 2014 Sales $ 554,143 $ 424,519 Cost of goods sold 333,594 266,173 2013 $ 294,600 188,544 Gross profit Selling expenses Administrative expenses 220,549 78,688 49,873 158,346 58,584 37,358 106,056 38,887 24,452 Total expenses 128,561 95,942 63,339...
Problem 13-2A Ratios, common-size statements, and trend percents LO P1, P2, P3 [The following information applies...
 Problem 13-2A Ratios, common-size statements, and trend percents LO P1, P2, P3 [The following information applies to the questions displayed below. Selected comparative financial statements of Korbin Company follow. KORBIN COMPANY Comparative Income Statements For Years Ended December 31, 2019, 2018, and 2017 2019 2017 2018 Sales $241,600 154,624 86,976 31,891 20,053 51,944 $454,450 $348,146 220,725 127,421 48,044 30,637 78,681 273,579 180,871 64,532 40,901 Cost of goods sold Gross profit Selling expenses Administrative expenses Total expenses 105,433 75,438 14,031 48,740...
Required information Problem 17-2A Ratios, common-size statements, and trend percents LO P1, P2, P3 [The following...
 Required information Problem 17-2A Ratios, common-size statements, and trend percents LO P1, P2, P3 [The following information applies to the questions displayed below.) Selected comparative financial statements of Korbin Company follow. KORBIN COMPANY Comparative Income Statements For Years Ended December 31, 2019, 2018, and 2017 2019 2018 2017 Sales $ 494,327 $ 378,695 $ 262,800 Cost of goods sold 297,585 238, 199168,192 Gross profit 196, 742 140,496 94,608 Selling expenses 70,194 52,260 34,690 Administrative expenses 44,489 33, 325 21,812 Total...
Required Information Problem 13-2A Ratios, common-size statements, and trend percents LO P1, P2, P3 The following...
 Required Information Problem 13-2A Ratios, common-size statements, and trend percents LO P1, P2, P3 The following information applies to the questions displayed below.) Selected comparative financial statements of Korbin Company follow KORBIN COMPANY Comparative Income Statements For Years Ended December 31, 2017, 2016, and 2015 2017 2016 2015 Sales $ 494,327 378,695 $ 262,800 Cost of goods sold 297,585 237,820 168,192 Gross profit 196,742 148,875 94,608 Selling expenses 70,194 52,260 34,690 Administrative expenses 44,489 33,325 21,812 Total expenses 114,683 85.585...
Problem 13-2A Ratios, common-size statements, and trend percents LO P1, P2, P3 [The following information applies...
 Problem 13-2A Ratios, common-size statements, and trend percents LO P1, P2, P3 [The following information applies to the questions displayed below.] Selected comparative financial statements of Korbin Company follow. KORBIN COMPANY Comparative Income Statements For Years Ended December 31, 2017, 2016, and 2015 2017 2016 2015 Sales $555,000 $340,000 $278,000 Cost of goods sold 283,500 212,500 153,900 Gross profit 271,500 127,500 124,100 Selling expenses 102,900 46,920 50,800 Administrative expenses 50,668 29,920 22,800 Total expenses 153,568 76,840 73,600 Income before taxes...
Problem 13-2A Ratios, common-size statements, and trend percents LO P1, P2, P3 [The following information applies...
Problem 13-2A Ratios, common-size statements, and trend percents LO P1, P2, P3 [The following information applies to the questions displayed below.] Selected comparative financial statements of Korbin Company follow: KORBIN COMPANY Comparative Income Statements For Years Ended December 31, 2017, 2016, and 2015 2017 2016 2015 Sales $ 496,208 $ 380,136 $ 263,800 Cost of goods sold 298,717 237,965 168,832 Gross profit 197,491 142,171 94,968 Selling expenses 70,462 52,459 34,822 Administrative expenses 44,659 33,452 21,895 Total expenses 115,121 85,911 56,717...
Required Information Problem 13-2A Ratios, common-size statements, and trend percents LO P1, P2, P3 [The following...
 Required Information Problem 13-2A Ratios, common-size statements, and trend percents LO P1, P2, P3 [The following information applies to the questions displayed below.) Selected comparative financial statements of Korbin Company follow KORBIN COMPANY Comparative Income Statements For Years Ended December 31, 2017, 2016, and 2015 2017 2016 2015 $ 494,327 S 378,695 $ 262,800 Cost of goods sold 297,585 237,820 168,192 Gross profit 196,742 140,875 Selling expenses 70.194 52.26 34,690 Anistratives 44.489 21,812 Total expenses 85.585 56,582 Income before the...
 Problem 13-2A Ratios, common-size statements, and trend percents LO P1, P2, P3 The following information applies to the questions clsplayed below) Selected comparative financial statements of Korbin Company follow KORBIN COMPANY Comparative Income Statements For Years Ended December 31, 2017, 2016, and 2015 2017 2016 2015 Sales $432,442 $331,286 $229,900 Cost of goods sold 260,330 207,054 147, 136 Gross profit 172,112 124,232 82,764 Selling expenses 61, 407 45,717 30,347 Administrative expenses 38,920 29,153 19,082 Total expenses 100, 327 74,870 49,429...
 Problem 17-2A Ratios, common-size statements, and trend percents LO P1, P2, P3 The following information applies to the questions displayed below] Selected comparative financial statements of Korbin Company follow Comparative Income Statements For Year Ended December 31, 2017 2016 $ $ 457,083 275,164 181,919 64,986 41 137 186,043 75,876 112 Cast of goods sold Gross profit Selling expenses Administrative expenses Total expenses Income before taxes Income taxes Net Income 350, 163 221 653 128.51e 48,322 30,814 79,136 49,374 10 122...
 Problem 13-2A Ratios, common-size statements, and trend percents LO P1, P2, P3 [The following information applies to the questions displayed below.] Selected comparative financial statements of Korbin Company follow KORBIN COMPANY Comparative Income Statements For Years Ended December 31, 2015, 2014, and 2013 2015 2014 Sales $ 554,143 $ 424,519 Cost of goods sold 333,594 266,173 2013 $ 294,600 188,544 Gross profit Selling expenses Administrative expenses 220,549 78,688 49,873 158,346 58,584 37,358 106,056 38,887 24,452 Total expenses 128,561 95,942 63,339...
 Problem 13-2A Ratios, common-size statements, and trend percents LO P1, P2, P3 [The following information applies to the questions displayed below. Selected comparative financial statements of Korbin Company follow. KORBIN COMPANY Comparative Income Statements For Years Ended December 31, 2019, 2018, and 2017 2019 2017 2018 Sales $241,600 154,624 86,976 31,891 20,053 51,944 $454,450 $348,146 220,725 127,421 48,044 30,637 78,681 273,579 180,871 64,532 40,901 Cost of goods sold Gross profit Selling expenses Administrative expenses Total expenses 105,433 75,438 14,031 48,740...
 Required information Problem 17-2A Ratios, common-size statements, and trend percents LO P1, P2, P3 [The following information applies to the questions displayed below.) Selected comparative financial statements of Korbin Company follow. KORBIN COMPANY Comparative Income Statements For Years Ended December 31, 2019, 2018, and 2017 2019 2018 2017 Sales $ 494,327 $ 378,695 $ 262,800 Cost of goods sold 297,585 238, 199168,192 Gross profit 196, 742 140,496 94,608 Selling expenses 70,194 52,260 34,690 Administrative expenses 44,489 33, 325 21,812 Total...
 Required Information Problem 13-2A Ratios, common-size statements, and trend percents LO P1, P2, P3 The following information applies to the questions displayed below.) Selected comparative financial statements of Korbin Company follow KORBIN COMPANY Comparative Income Statements For Years Ended December 31, 2017, 2016, and 2015 2017 2016 2015 Sales $ 494,327 378,695 $ 262,800 Cost of goods sold 297,585 237,820 168,192 Gross profit 196,742 148,875 94,608 Selling expenses 70,194 52,260 34,690 Administrative expenses 44,489 33,325 21,812 Total expenses 114,683 85.585...
 Problem 13-2A Ratios, common-size statements, and trend percents LO P1, P2, P3 [The following information applies to the questions displayed below.] Selected comparative financial statements of Korbin Company follow. KORBIN COMPANY Comparative Income Statements For Years Ended December 31, 2017, 2016, and 2015 2017 2016 2015 Sales $555,000 $340,000 $278,000 Cost of goods sold 283,500 212,500 153,900 Gross profit 271,500 127,500 124,100 Selling expenses 102,900 46,920 50,800 Administrative expenses 50,668 29,920 22,800 Total expenses 153,568 76,840 73,600 Income before taxes...
 Required Information Problem 13-2A Ratios, common-size statements, and trend percents LO P1, P2, P3 [The following information applies to the questions displayed below.) Selected comparative financial statements of Korbin Company follow KORBIN COMPANY Comparative Income Statements For Years Ended December 31, 2017, 2016, and 2015 2017 2016 2015 $ 494,327 S 378,695 $ 262,800 Cost of goods sold 297,585 237,820 168,192 Gross profit 196,742 140,875 Selling expenses 70.194 52.26 34,690 Anistratives 44.489 21,812 Total expenses 85.585 56,582 Income before the...
Most questions answered within 3 hours.
-
A student takes a multiple-choice test that has 10 questions.
Each question has two choices. The...
asked 19 minutes ago -
Willie Keeler has a lifetime batting average of 0.341. Assume
that Willie Keeler came to bat...
asked 21 minutes ago -
Which of the following has the highest boiling point?
A) 0.5m NaCl
B) 0.5m C6H12O6
C)...
asked 40 minutes ago -
12. A firm is producing at an output level where
AR = MC > AC >...
asked 37 minutes ago -
Radovilsky Manufacturing Company, in Hayward, California,
makes flashing lights for toys. The company operates its production...
asked 39 minutes ago -
As an athlete exercises, sweat is produced and evaporated to
jelp maintain a proper body temperature....
asked 39 minutes ago -
Which of these macromolecules is most prevalent (by mass) in the
environment? What particular challenge does...
asked 40 minutes ago -
Consider two stocks. Stock A has a standard deviation of 46% and
stock B has a...
asked 44 minutes ago -
Give a unary language (using only input alphabet ∑={1} )that is
not Turing- recognizable and prove...
asked 55 minutes ago -
1. Write the balanced net reaction for a Ti (s) | TiCl2 (aq) ||
InCl3 (aq)...
asked 52 minutes ago -
3) Answer the following questions:please respond in one
paragraph
In your opinion, what are the crucial...
asked 59 minutes ago -
Assume that the readings at freezing on a batch of thermometers
are normally distributed with a...
asked 1 hour ago