


Homework Answers


0.1) The test statistics is given by
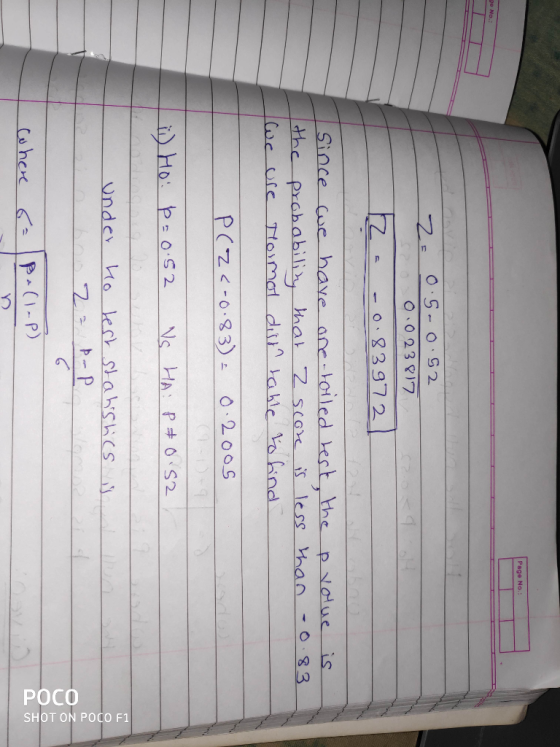
Z= -0.83972
a.2) p-value is 0.2005 so p-value>=0.10
a.3)At the 0.10 significance level Do not reject H0 since the p-value is is greater than significance level.
a.4) we cannot conclude that sample proportion is less than 0.52.
b.1) The test statistics is given by
Z= -0.83972
b.2) p-value is 0.401 so p-value>=0.10
b.3) At the 0.10 significance level Do not reject H0 since the p-value is is greater than significance level.
b.4) we cannot conclude that population proportion dffers from 0.52
Add Answer to:
In order to conduct a hypothesis test for the population proportion, you sample 440 observations that...
In order to conduct a hypothesis test for the population proportion, you sample 440 observations that...
 In order to conduct a hypothesis test for the population proportion, you sample 440 observations that result in 220 successes. (You may find it useful to reference the appropriate table: z table or table) He: p > 0.52; HA: p < 0.52. a-1. Calculate the value of the test statistic, (Negative value should be indicated by a minus sign. Round intermediate calculations to at least 4 decimal places and final answer to 2 decimal places.) Test statistic a-2. Find the...
In order to conduct a hypothesis test for the population proportion, you sample 300 observations that...
 In order to conduct a hypothesis test for the population proportion, you sample 300 observations that result in 111 successes. (You may find it useful to reference the appropriate table: z table or t table) HO : p o.41; HA p< 0.41. a-1. Calculate the value of the test statistic. (Negative value should be indicated by a minus sign. Round intermediate calculations to at least 4 decimal places and final answer to 2 decimal places.) Test statistic a-2. Find the...
n order to conduct a hypothesis test for the population proportion, you sample 480 observations that...
 n order to conduct a hypothesis test for the population proportion, you sample 480 observations that result in 264 successes. (You may find it useful to reference the appropriate table: z table or t table) Ho: pz 0.60 HA: p0.60 a-1. Calculate the value of the test statistic. (Negative value should be indicated by a minus sign. Round intermediate calculations to at least 4 decimal places and final answer to 2 decimal places.) Test statistic 2.24 a-2. Find the p-value....
In order to conduct a hypothesis test for the population proportion, you sample 320 observations that...
 In order to conduct a hypothesis test for the population proportion, you sample 320 observations that result in 128 successes.(You may find it useful to reference the appropriate table: z table or t table HO pz 0.45; HA: p < 0.45. a-1. Calculate the value of the test statistic. (Negative value should be indicated by a minus sign. Round intermediate calculations to at least 4 decimal places and final answer to 2 decimal places.) est statistic a-2. Find the p-value....
In order to conduct a hypothesis test for the population proportion, you sample 290 observations that...
In order to conduct a hypothesis test for the population proportion, you sample 290 observations that result in 87 successes. (You may find it useful to reference the appropriate table: z table or t table) H0: p ≥ 0.36; HA: p < 0.36. a-1. Calculate the value of the test statistic. (Negative value should be indicated by a minus sign. Round intermediate calculations to at least 4 decimal places and final answer to 2 decimal places.) a-2. Find the p-value....
In order to conduct a hypothesis test for the population proportion, you sample 450 observations that...
 In order to conduct a hypothesis test for the population
proportion, you sample 450 observations that result in 189
successes. (You may find it useful to reference the
appropriate table: z table or t
table)
H0: p ≥ 0.45;
HA: p < 0.45.
a-1. Calculate the value of the test statistic.
(Negative value should be indicated by a minus sign. Round
intermediate calculations to at least 4 decimal places and final
answer to 2 decimal places.)
TEST STATISTIC =
a-2....
In order to conduct a hypothesis test for the population
proportion, you sample 450 observations that result in 189
successes. (You may find it useful to reference the
appropriate table: z table or t
table)
H0: p ≥ 0.45;
HA: p < 0.45.
a-1. Calculate the value of the test statistic.
(Negative value should be indicated by a minus sign. Round
intermediate calculations to at least 4 decimal places and final
answer to 2 decimal places.)
TEST STATISTIC =
a-2....
In order to conduct a hypothesis test for the population mean, a random sample of 20...
 In order to conduct a hypothesis test for the population mean, a random sample of 20 observations is drawn from a normally distributed population. The resulting sample mean and sample standard deviation are calculated as 12.9 and 2.4, respectively. (You may find it useful to reference the appropriate table: z table or ttable). Ho : μ 12.1 against HA: μ > 12.1 a-1. Calculate the value of the test statistic. (Round all intermediate calculations to at least 4 decimal places...
In order to conduct a hypothesis test for the population mean, a random sample of 28...
 In order to conduct a hypothesis test for the population mean, a random sample of 28 observations is drawn from a normally distributed population. The resulting sample mean and sample standard deviation are calculated as 17.9 and 1.5, respectively. (You may find it useful to reference the appropriate table: z table or t table). HO: MS 17.5 against HA: > 17.5 a-1. Calculate the value of the test statistic. (Round all intermediate calculations to at least 4 decimal places and...
In order to conduct a hypothesis test for the population mean, a random sample of 28...
 In order to conduct a hypothesis test for the population mean, a random sample of 28 observations is drawn from a normally distributed population. The resulting sample mean and sample standard deviation are calculated as 17.9 and 1.5, respectively. (You may find it useful to reference the appropriate table: z table or t table) H0 : μ 17.5 against HA: μ > 17.5 a-1. Calculate the value of the test statistic. (Round all intermediate calculations to at least 4 decimal...
In order to conduct a hypothesis test for the population mean, a random sample of 24...
 In order to conduct a hypothesis test for the population mean, a random sample of 24 observations is drawn from a normally distributed population. The resulting sample mean and sample standard deviation are calculated as 4.8 and 0.8, respectively. (You may find it useful to reference the appropriate table: z table or t table) H0 : μ s 4 , 5 against HA: μ > 4 . 5 a-1. Calculate the value of the test statistic. (Round all intermediate calculations...
 In order to conduct a hypothesis test for the population proportion, you sample 440 observations that result in 220 successes. (You may find it useful to reference the appropriate table: z table or table) He: p > 0.52; HA: p < 0.52. a-1. Calculate the value of the test statistic, (Negative value should be indicated by a minus sign. Round intermediate calculations to at least 4 decimal places and final answer to 2 decimal places.) Test statistic a-2. Find the...
 In order to conduct a hypothesis test for the population proportion, you sample 300 observations that result in 111 successes. (You may find it useful to reference the appropriate table: z table or t table) HO : p o.41; HA p< 0.41. a-1. Calculate the value of the test statistic. (Negative value should be indicated by a minus sign. Round intermediate calculations to at least 4 decimal places and final answer to 2 decimal places.) Test statistic a-2. Find the...
 n order to conduct a hypothesis test for the population proportion, you sample 480 observations that result in 264 successes. (You may find it useful to reference the appropriate table: z table or t table) Ho: pz 0.60 HA: p0.60 a-1. Calculate the value of the test statistic. (Negative value should be indicated by a minus sign. Round intermediate calculations to at least 4 decimal places and final answer to 2 decimal places.) Test statistic 2.24 a-2. Find the p-value....
 In order to conduct a hypothesis test for the population proportion, you sample 320 observations that result in 128 successes.(You may find it useful to reference the appropriate table: z table or t table HO pz 0.45; HA: p < 0.45. a-1. Calculate the value of the test statistic. (Negative value should be indicated by a minus sign. Round intermediate calculations to at least 4 decimal places and final answer to 2 decimal places.) est statistic a-2. Find the p-value....
 In order to conduct a hypothesis test for the population
proportion, you sample 450 observations that result in 189
successes. (You may find it useful to reference the
appropriate table: z table or t
table)
H0: p ≥ 0.45;
HA: p < 0.45.
a-1. Calculate the value of the test statistic.
(Negative value should be indicated by a minus sign. Round
intermediate calculations to at least 4 decimal places and final
answer to 2 decimal places.)
TEST STATISTIC =
a-2....
In order to conduct a hypothesis test for the population
proportion, you sample 450 observations that result in 189
successes. (You may find it useful to reference the
appropriate table: z table or t
table)
H0: p ≥ 0.45;
HA: p < 0.45.
a-1. Calculate the value of the test statistic.
(Negative value should be indicated by a minus sign. Round
intermediate calculations to at least 4 decimal places and final
answer to 2 decimal places.)
TEST STATISTIC =
a-2....
 In order to conduct a hypothesis test for the population mean, a random sample of 20 observations is drawn from a normally distributed population. The resulting sample mean and sample standard deviation are calculated as 12.9 and 2.4, respectively. (You may find it useful to reference the appropriate table: z table or ttable). Ho : μ 12.1 against HA: μ > 12.1 a-1. Calculate the value of the test statistic. (Round all intermediate calculations to at least 4 decimal places...
 In order to conduct a hypothesis test for the population mean, a random sample of 28 observations is drawn from a normally distributed population. The resulting sample mean and sample standard deviation are calculated as 17.9 and 1.5, respectively. (You may find it useful to reference the appropriate table: z table or t table). HO: MS 17.5 against HA: > 17.5 a-1. Calculate the value of the test statistic. (Round all intermediate calculations to at least 4 decimal places and...
 In order to conduct a hypothesis test for the population mean, a random sample of 28 observations is drawn from a normally distributed population. The resulting sample mean and sample standard deviation are calculated as 17.9 and 1.5, respectively. (You may find it useful to reference the appropriate table: z table or t table) H0 : μ 17.5 against HA: μ > 17.5 a-1. Calculate the value of the test statistic. (Round all intermediate calculations to at least 4 decimal...
 In order to conduct a hypothesis test for the population mean, a random sample of 24 observations is drawn from a normally distributed population. The resulting sample mean and sample standard deviation are calculated as 4.8 and 0.8, respectively. (You may find it useful to reference the appropriate table: z table or t table) H0 : μ s 4 , 5 against HA: μ > 4 . 5 a-1. Calculate the value of the test statistic. (Round all intermediate calculations...
Most questions answered within 3 hours.
-
Please respond to each of the below questions in a minimum of 5
well written paragraphs...
asked 36 seconds ago -
On January 1, Year 1, Brown Co. issued bonds with a face value
of $115,000, a...
asked 6 minutes ago -
calculate the oxidation state of carbons C18H36O2 and
C18H36018
and then calculated the number of electrons...
asked 6 minutes ago -
It is better to optimize alpha by using trial and error methods
or by using methods...
asked 14 minutes ago -
An urn contains 39 red, 17 white and 30 blue marbles. A child
selects two marbles...
asked 16 minutes ago -
A student conducting this experiment weighs out 2.80 g of
CoCl2.6H2O.
For this part you will...
asked 24 minutes ago -
A cube, 100.0m on a side, has a total charge of 12.0 nC
distributed uniformly on...
asked 14 minutes ago -
Let's consider that two hockey players with equal mass, moving
with the same speed of 10...
asked 15 minutes ago -
Find the mid-range for the given sample data. Listed
below are the amounts of time (in...
asked 32 minutes ago -
If one wants to airlift a “thanksgiving’s” turkey (mass=3kg)
using a balloon. What would be the...
asked 28 minutes ago -
An institute reported that 63% of its members indicate that
lack of ethical culture within financial...
asked 31 minutes ago -
A proposal to your local city council in which you propose how
to use the money...
asked 40 minutes ago