TABLE 2.5
Income Statement 2015 2016
2017 2018 2019
Revenue 405.5 363.6
419.6 509.2 602.3
Cost of Goods Sold (184.2)
(172.1) (206.0) (243.4)
(296.0)
Gross Profit 221.3 191.5
213.6 265.8 306.3
Sales and Marketing (68.6)
(67.3) (84.0) (100.5)
(121.0)
Administration (61.8) (60.1)
(58.6) (67.5) (78.2)
Depreciation & Amortization (25.6)
(25.7) (35.5) (38.5)
(37.7)
EBIT 65.3 38.4 35.5
59.3 69.4
Interest Income (Expense) (31.8)
(33.4) (30.9) (38.0)
(39.3)
Pretax Income 33.5 5.0
4.6 21.3 30.1
Income Tax (11.7) (1.8)
(1.6) (7.5) (10.5)
Net Income 21.8 3.2
3.0 13.8 19.6
Shares outstanding (millions) 54.7
54.7 54.7 54.7
54.7
Earnings per share $0.40 $0.06
$0.05 $0.25 $0.36
Balance Sheet 2015 2016
2017 2018 2019
Assets
Cash 50.1 73.4 88.4
77.6 85.8
Accounts Receivable 90.4 69.2
69.9 78.7 84.4
Inventory 35.2 32.1
27.6 30.3 35.9
Total Current Assets 175.7
174.7 185.9 186.6
206.1
Net Property, Plant & Equip. 244.8
246.1 306.7 347.5
349.6
Goodwill & Intangibles 356.7
356.7 356.7 356.7
356.7
Total Assets 777.2 777.5
849.3 890.8 912.4
Liabilities & Stockholders' Equity
Accounts Payable 18.5 19.8
23.7 24.9 31.7
Accrued Compensation 7.5 5.8
6.5 8.7 9.5
Total Current Liabilities 26.0
25.6 30.2 33.6
41.2
Long-term Debt 497.9 497.9
573.7 598.9 598.9
Total Liabilities 523.9 523.5
603.9 632.5 640.1
Stockholders' Equity 253.3
254.0 245.4 258.3
272.3
Total Liabilities & Stockholders' Equity
777.2 777.5 849.3
890.8 912.4
Statement of Cash Flows 2015
2016 2017 2018
2019
Net Income 21.8 3.2
3.0 13.8 19.6
Depreciation & Amortization 25.6
25.7 35.5 38.5
37.7
Chg. in Accounts Receivable 3.9
21.2 -0.7 (8.8)
(5.7)
Chg. in Inventory (2.9) 3.1
4.5 (2.7) (5.6)
Chg. in Pay. & Accrued Comp. 2.6
(0.4) 4.6 3.4
7.6
Cash from Operations 51.0 52.8
46.9 44.2 53.6
Capital Expenditures (25.4)
(24.1) (102.3) (74.8)
(39.8)
Cash from Investing Activ. (25.4)
(24.1) (102.3) (74.8)
(39.8)
Dividends Paid (5.4) (5.4)
(5.4) (5.4) (5.6)
Sale (or purchase) of stock - -
- - -
Debt Issuance (Pay Down) - -
75.8 25.2 -
Cash from Financing Activ. (5.4)
(5.4) 70.4 19.8
(5.6)
Change in Cash 20.2 23.3
15.0 (10.8) 8.2
Mydeco Stock Price $8.89 $4.21
$4.66 $9.51 $12.19
Homework Answers
SEE THE IMAGE. ANY DOUBTS, FEEL FREE TO ASK. THUMBS UP
PLEASE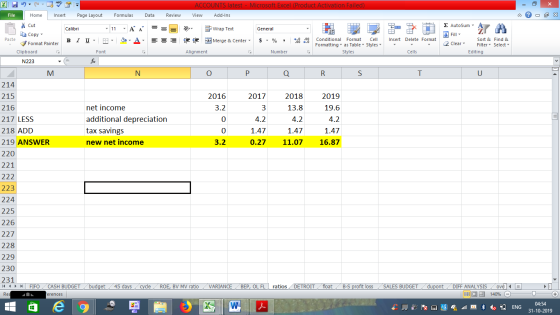
give me the answers and explanation ! 2019 45 603.6 (59.4) 2015–2019 Financial Statement Data and...
 give me the answers and explanation !
2019 45 603.6 (59.4) 2015–2019 Financial Statement Data and Stock Price Data for Mydeco Corp. (All data as of fiscal year end; in $ millions) Income Statement 2015 2016 2017 2018 Revenue 398.5 364.5 429.1 510.6 Cost of Goods Sold (193.0) (176.6) (209.7) (249.2) Gross Profit 205.5 187.9 219.4 261.4 Sales and Marketing (66.0) (65.9) (84.8) (100.3) Administration (57.9) (57.5) (66.5) Depreciation & Amortization (29.0) (25.7) (35.0) (39.9) EBIT 51.1 38.4 42.1 54.7...
give me the answers and explanation !
2019 45 603.6 (59.4) 2015–2019 Financial Statement Data and Stock Price Data for Mydeco Corp. (All data as of fiscal year end; in $ millions) Income Statement 2015 2016 2017 2018 Revenue 398.5 364.5 429.1 510.6 Cost of Goods Sold (193.0) (176.6) (209.7) (249.2) Gross Profit 205.5 187.9 219.4 261.4 Sales and Marketing (66.0) (65.9) (84.8) (100.3) Administration (57.9) (57.5) (66.5) Depreciation & Amortization (29.0) (25.7) (35.0) (39.9) EBIT 51.1 38.4 42.1 54.7...
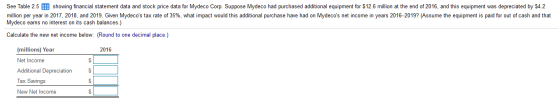
See Table 2.5 E showing financial statement data and stock price data for Mydeco Corp. Suppose...
 See Table 2.5 E showing financial statement data and stock price data for Mydeco Corp. Suppose Mydeco repurchases 1.6 million shares each year from 2016 to 2019. What would be its earnings per share in 2019? (Assume Mydeco pays for the shares using its available cash and that Mydeco earns no interest on its cash balances.) (Select the best choice below.) O A. A repurchase does not impact earnings directly, so any change to EPS will come from a reduction...
please answer the questions for 2016-2019. Thank you! 2-12 (book/static) Question Help See Table 2.5 m...
 please answer the questions for 2016-2019. Thank you!
2-12 (book/static) Question Help See Table 2.5 m showing financial statement data and stock price data for Mydeco Corp. Suppose Mydeco's cows and expenses had been the same fraction of revenues in 2016-2019 as they were in 2015. What would Mydeco's EPS have been each year in this case? Calculate the new EPS for 2016-2019 bow Found dollar amounts and number of shares to one decimal place. Round percentage amount and the...
please answer the questions for 2016-2019. Thank you!
2-12 (book/static) Question Help See Table 2.5 m showing financial statement data and stock price data for Mydeco Corp. Suppose Mydeco's cows and expenses had been the same fraction of revenues in 2016-2019 as they were in 2015. What would Mydeco's EPS have been each year in this case? Calculate the new EPS for 2016-2019 bow Found dollar amounts and number of shares to one decimal place. Round percentage amount and the...
Requirements: a. In what year was Mydeco's net income the lowest and what was the amount?...
 Requirements:
a. In what year was Mydeco's net income the lowest and what
was the amount?
b. In what year did Mydeco need to reduce its cash reserves and
what was the amount?
c. Why did Mydeco need to reduce its cash reserves in a year
when net income was reasonably high? (please include the numerical
amounts)
2012-2016 Financial Statement Data and Stock Price Data for Mydeco Corp. (All data as of fiscal year end; in $ millions) Income Statement...
Requirements:
a. In what year was Mydeco's net income the lowest and what
was the amount?
b. In what year did Mydeco need to reduce its cash reserves and
what was the amount?
c. Why did Mydeco need to reduce its cash reserves in a year
when net income was reasonably high? (please include the numerical
amounts)
2012-2016 Financial Statement Data and Stock Price Data for Mydeco Corp. (All data as of fiscal year end; in $ millions) Income Statement...
Requirements: a. By what percentage did Mydeco's revenues grow each year from 2013 to 2016? b....
 Requirements:
a. By what percentage did Mydeco's revenues grow each
year from 2013 to 2016?
b. By what percentage did net income grow each
year?
c. Why might the growth rates of revenues and net income
differ?
2016 608.1 (293.9) 314.2 (125.7) (78.5) (37.4) 72.6 (40.7) 31.9 (11.2) 20.7 54.7 $0.38 2016 2012 2012--2016 Financial Statement Data and Stock Price Data for Mydeco Corp. (All data as of fiscal year end; in $ millions) Income Statement 2012 2013 2014 2015...
Requirements:
a. By what percentage did Mydeco's revenues grow each
year from 2013 to 2016?
b. By what percentage did net income grow each
year?
c. Why might the growth rates of revenues and net income
differ?
2016 608.1 (293.9) 314.2 (125.7) (78.5) (37.4) 72.6 (40.7) 31.9 (11.2) 20.7 54.7 $0.38 2016 2012 2012--2016 Financial Statement Data and Stock Price Data for Mydeco Corp. (All data as of fiscal year end; in $ millions) Income Statement 2012 2013 2014 2015...
In what year was Mydeco's net income the lowest? b. In what year did Mydeco need...
In what year was Mydeco's net income the lowest? b. In what year did Mydeco need to reduce its cash reserves? c. Why did Mydeco need to reduce its cash reserves in a year when net income was reasonably high? Income Statement 2012 2013 2014 2015 2016 Revenue 390.4 365.9 429.5 510.8 606.5 Cost of Goods Sold (187.9) (173.8) (206.0) (246.2) (293.8) Gross Profit 202.5 192.1 223.5 264.6 312.7 Sales and Marketing (68.2) (67.9) (82.9) (105.5) (125.5) Administration (60.7) (58.3) ...
See Table showing financial statement data and stock price data for Mydeco Corp a. How did...
 See Table showing financial statement data and stock
price data for Mydeco Corp
a. How did Mydeco's accounts receivable days change over this period? The accounts receivable days for 2012 is days. (Round to one decimal place.) The accounts receivable days for 2016 is ys. (Round to one decimal place.) b. How did Mydeco's inventory days change over this period? Inventory days for 2012 is days. (Round to one decimal place.) Inventory days for 2016 is days. (Round to one...
See Table showing financial statement data and stock
price data for Mydeco Corp
a. How did Mydeco's accounts receivable days change over this period? The accounts receivable days for 2012 is days. (Round to one decimal place.) The accounts receivable days for 2016 is ys. (Round to one decimal place.) b. How did Mydeco's inventory days change over this period? Inventory days for 2012 is days. (Round to one decimal place.) Inventory days for 2016 is days. (Round to one...
Requirements: a. By what percentage did Mydeco's revenues grow each year from 2013 to 2016? b....
 Requirements:
a. By what percentage did Mydeco's revenues grow each
year from 2013 to 2016?
b. By what percentage did net income grow each
year?
c. Why might the growth rates of revenues and net income
differ?
2016 601.3 (292.0) 309.3 (121.3) (77.0) (40.4) 70.6 (40.9) 29.7 (10.4) 19.3 56.2 $0.34 2016 21.6 2012--2016 Financial Statement Data and Stock Price Data for Mydeco Corp. (All data as of fiscal year end; in $ millions) Income Statement 2012 2013 2014 2015...
Requirements:
a. By what percentage did Mydeco's revenues grow each
year from 2013 to 2016?
b. By what percentage did net income grow each
year?
c. Why might the growth rates of revenues and net income
differ?
2016 601.3 (292.0) 309.3 (121.3) (77.0) (40.4) 70.6 (40.9) 29.7 (10.4) 19.3 56.2 $0.34 2016 21.6 2012--2016 Financial Statement Data and Stock Price Data for Mydeco Corp. (All data as of fiscal year end; in $ millions) Income Statement 2012 2013 2014 2015...
***The info is just on two separate pages.... all the information you need is here. Thank...
 ***The info is just on two separate pages.... all the
information you need is here. Thank you
Requirements:
a. How much cash did Mydeco have at the end of 2011?
1. The amount in cash at the end of 2011 was $___ million.
(Round to one decimal)
b. What were Mydeco's accounts receivable and inventory at the
end of 2011?
2. The amount in accounts receivable at the end of 2011 was
$____million. (Round to one decimal)
3. The amount...
***The info is just on two separate pages.... all the
information you need is here. Thank you
Requirements:
a. How much cash did Mydeco have at the end of 2011?
1. The amount in cash at the end of 2011 was $___ million.
(Round to one decimal)
b. What were Mydeco's accounts receivable and inventory at the
end of 2011?
2. The amount in accounts receivable at the end of 2011 was
$____million. (Round to one decimal)
3. The amount...
Table 1 2012-2016 Financial Statement Data and Stock Price Data for MyNature Income Statement MyNature Corp....
 Table 1 2012-2016 Financial Statement Data and Stock Price Data for MyNature Income Statement MyNature Corp. 2012-2016(All data as of fiscal year end; S in millions) 2012 2013 2014 2015 2016 404.3363.8 424.6 510.7 604.1 188.3 -173.8 -206.2 -246.8 -293.4 216 218.4 263.9 310.7 66.7 -66.4 82.8-102. -120.8 -60.6 -59.-59.466.4 78.5 27.3-2734.3 38.4 -38.6 57 72.8 33.7 32.9-32.2 -37.4 -39.4 9.7 19.6 33.4 3.4 -6.9 11.7 6.3 127 21.7 Revenue Cost of Goods Sold Gross proft Sales and Marketing Administration...
 give me the answers and explanation !
2019 45 603.6 (59.4) 2015–2019 Financial Statement Data and Stock Price Data for Mydeco Corp. (All data as of fiscal year end; in $ millions) Income Statement 2015 2016 2017 2018 Revenue 398.5 364.5 429.1 510.6 Cost of Goods Sold (193.0) (176.6) (209.7) (249.2) Gross Profit 205.5 187.9 219.4 261.4 Sales and Marketing (66.0) (65.9) (84.8) (100.3) Administration (57.9) (57.5) (66.5) Depreciation & Amortization (29.0) (25.7) (35.0) (39.9) EBIT 51.1 38.4 42.1 54.7...
give me the answers and explanation !
2019 45 603.6 (59.4) 2015–2019 Financial Statement Data and Stock Price Data for Mydeco Corp. (All data as of fiscal year end; in $ millions) Income Statement 2015 2016 2017 2018 Revenue 398.5 364.5 429.1 510.6 Cost of Goods Sold (193.0) (176.6) (209.7) (249.2) Gross Profit 205.5 187.9 219.4 261.4 Sales and Marketing (66.0) (65.9) (84.8) (100.3) Administration (57.9) (57.5) (66.5) Depreciation & Amortization (29.0) (25.7) (35.0) (39.9) EBIT 51.1 38.4 42.1 54.7...
 See Table 2.5 E showing financial statement data and stock price data for Mydeco Corp. Suppose Mydeco repurchases 1.6 million shares each year from 2016 to 2019. What would be its earnings per share in 2019? (Assume Mydeco pays for the shares using its available cash and that Mydeco earns no interest on its cash balances.) (Select the best choice below.) O A. A repurchase does not impact earnings directly, so any change to EPS will come from a reduction...
 please answer the questions for 2016-2019. Thank you!
2-12 (book/static) Question Help See Table 2.5 m showing financial statement data and stock price data for Mydeco Corp. Suppose Mydeco's cows and expenses had been the same fraction of revenues in 2016-2019 as they were in 2015. What would Mydeco's EPS have been each year in this case? Calculate the new EPS for 2016-2019 bow Found dollar amounts and number of shares to one decimal place. Round percentage amount and the...
please answer the questions for 2016-2019. Thank you!
2-12 (book/static) Question Help See Table 2.5 m showing financial statement data and stock price data for Mydeco Corp. Suppose Mydeco's cows and expenses had been the same fraction of revenues in 2016-2019 as they were in 2015. What would Mydeco's EPS have been each year in this case? Calculate the new EPS for 2016-2019 bow Found dollar amounts and number of shares to one decimal place. Round percentage amount and the...
 Requirements:
a. In what year was Mydeco's net income the lowest and what
was the amount?
b. In what year did Mydeco need to reduce its cash reserves and
what was the amount?
c. Why did Mydeco need to reduce its cash reserves in a year
when net income was reasonably high? (please include the numerical
amounts)
2012-2016 Financial Statement Data and Stock Price Data for Mydeco Corp. (All data as of fiscal year end; in $ millions) Income Statement...
Requirements:
a. In what year was Mydeco's net income the lowest and what
was the amount?
b. In what year did Mydeco need to reduce its cash reserves and
what was the amount?
c. Why did Mydeco need to reduce its cash reserves in a year
when net income was reasonably high? (please include the numerical
amounts)
2012-2016 Financial Statement Data and Stock Price Data for Mydeco Corp. (All data as of fiscal year end; in $ millions) Income Statement...
 Requirements:
a. By what percentage did Mydeco's revenues grow each
year from 2013 to 2016?
b. By what percentage did net income grow each
year?
c. Why might the growth rates of revenues and net income
differ?
2016 608.1 (293.9) 314.2 (125.7) (78.5) (37.4) 72.6 (40.7) 31.9 (11.2) 20.7 54.7 $0.38 2016 2012 2012--2016 Financial Statement Data and Stock Price Data for Mydeco Corp. (All data as of fiscal year end; in $ millions) Income Statement 2012 2013 2014 2015...
Requirements:
a. By what percentage did Mydeco's revenues grow each
year from 2013 to 2016?
b. By what percentage did net income grow each
year?
c. Why might the growth rates of revenues and net income
differ?
2016 608.1 (293.9) 314.2 (125.7) (78.5) (37.4) 72.6 (40.7) 31.9 (11.2) 20.7 54.7 $0.38 2016 2012 2012--2016 Financial Statement Data and Stock Price Data for Mydeco Corp. (All data as of fiscal year end; in $ millions) Income Statement 2012 2013 2014 2015...
 See Table showing financial statement data and stock
price data for Mydeco Corp
a. How did Mydeco's accounts receivable days change over this period? The accounts receivable days for 2012 is days. (Round to one decimal place.) The accounts receivable days for 2016 is ys. (Round to one decimal place.) b. How did Mydeco's inventory days change over this period? Inventory days for 2012 is days. (Round to one decimal place.) Inventory days for 2016 is days. (Round to one...
See Table showing financial statement data and stock
price data for Mydeco Corp
a. How did Mydeco's accounts receivable days change over this period? The accounts receivable days for 2012 is days. (Round to one decimal place.) The accounts receivable days for 2016 is ys. (Round to one decimal place.) b. How did Mydeco's inventory days change over this period? Inventory days for 2012 is days. (Round to one decimal place.) Inventory days for 2016 is days. (Round to one...
 Requirements:
a. By what percentage did Mydeco's revenues grow each
year from 2013 to 2016?
b. By what percentage did net income grow each
year?
c. Why might the growth rates of revenues and net income
differ?
2016 601.3 (292.0) 309.3 (121.3) (77.0) (40.4) 70.6 (40.9) 29.7 (10.4) 19.3 56.2 $0.34 2016 21.6 2012--2016 Financial Statement Data and Stock Price Data for Mydeco Corp. (All data as of fiscal year end; in $ millions) Income Statement 2012 2013 2014 2015...
Requirements:
a. By what percentage did Mydeco's revenues grow each
year from 2013 to 2016?
b. By what percentage did net income grow each
year?
c. Why might the growth rates of revenues and net income
differ?
2016 601.3 (292.0) 309.3 (121.3) (77.0) (40.4) 70.6 (40.9) 29.7 (10.4) 19.3 56.2 $0.34 2016 21.6 2012--2016 Financial Statement Data and Stock Price Data for Mydeco Corp. (All data as of fiscal year end; in $ millions) Income Statement 2012 2013 2014 2015...
 ***The info is just on two separate pages.... all the
information you need is here. Thank you
Requirements:
a. How much cash did Mydeco have at the end of 2011?
1. The amount in cash at the end of 2011 was $___ million.
(Round to one decimal)
b. What were Mydeco's accounts receivable and inventory at the
end of 2011?
2. The amount in accounts receivable at the end of 2011 was
$____million. (Round to one decimal)
3. The amount...
***The info is just on two separate pages.... all the
information you need is here. Thank you
Requirements:
a. How much cash did Mydeco have at the end of 2011?
1. The amount in cash at the end of 2011 was $___ million.
(Round to one decimal)
b. What were Mydeco's accounts receivable and inventory at the
end of 2011?
2. The amount in accounts receivable at the end of 2011 was
$____million. (Round to one decimal)
3. The amount...
 Table 1 2012-2016 Financial Statement Data and Stock Price Data for MyNature Income Statement MyNature Corp. 2012-2016(All data as of fiscal year end; S in millions) 2012 2013 2014 2015 2016 404.3363.8 424.6 510.7 604.1 188.3 -173.8 -206.2 -246.8 -293.4 216 218.4 263.9 310.7 66.7 -66.4 82.8-102. -120.8 -60.6 -59.-59.466.4 78.5 27.3-2734.3 38.4 -38.6 57 72.8 33.7 32.9-32.2 -37.4 -39.4 9.7 19.6 33.4 3.4 -6.9 11.7 6.3 127 21.7 Revenue Cost of Goods Sold Gross proft Sales and Marketing Administration...
Most questions answered within 3 hours.
-
Java Please
Source Only
Program 2: All Hail Modulus Agustus! The modulus operator is
used all...
asked 19 minutes ago -
What is the limiting reagent in a reaction of 12g of Sodium
chloride and 23g of...
asked 20 minutes ago -
Illustrate and explain using diagrams, the difference between
long run supply in a constant cost individual...
asked 17 minutes ago -
The
following items are taken from the annual financial statements of
Opco Company at December 31,...
asked 23 minutes ago -
Write a c++ program that shows the 10 employees record which is
not allowed to be...
asked 26 minutes ago -
The team of psychologists suggested that the type of instruction
should match with...?
asked 27 minutes ago -
Prepare a MARIE program to encode your full name using Unicode /
ASCII characters. You should...
asked 33 minutes ago -
To make bond purchases, the Fed gets the money __________.
Select the correct answer below:
exclusively...
asked 27 minutes ago -
Three masses of mass M=1.2kg are initially located at
positions:
r1→=4.0m i+2.8m j −4.4mk
r2→=5.4m i+1.0m...
asked 53 minutes ago -
List and briefly describe the three types of thermoelectric
sensors.
asked 53 minutes ago -
A bond has a $1,000 par value, 20 years to maturity and a 5%
annual coupon...
asked 54 minutes ago -
The three key cash-related activities of a firm are
operational activities, non-current activities and financing
activities....
asked 4 hours ago