Math533 Keller graduate university Project B Complete the following four hypotheses, using α = 0.05 for...
Math533 Keller graduate university Project B
Complete the following four hypotheses, using α = 0.05 for each. a. Mean sales for all stores is at least $52,000 b. Proportion of stores with a medium market size is less than 55% c. Mean sales for promotion #3 is more than $45,000 per week d. Mean store age is greater than 8 years. 1. Using the same data set from part A, perform the hypothesis test for each speculation in order to see if there is evidence to support the manager's belief. Use the Seven Elements of a Test of Hypothesis from Section 7.1 of your text book, as well as the p-value calculation from Section 7.3, and explain your conclusion in simple terms. 2. Compute 99% confidence intervals for each of the variables described in a.-d., and interpret these intervals. 3. Write a report about the results, distilling down the results in a way that would be understandable to someone who does not know statistics. Clear explanations and interpretations are critical.
Homework Answers
1.
a.
Let the population mean =
1.Null Hypothesis(H0):
2. Alternative Hypothesis(H1):
(right tailed test)
3. Set significance level():
=5%
4. Collect data:
Let the sample size, sample mean and sample standard deviation of the data (since not given in the question) be:
Sample size, n =25; Sample mean, =52,500 and
Sample std.deviation, s =4,000
5. Test statistic:
t =
=(52,500 - 52,000)/(4,000/
)
=0.625
6. Rejection region and p-value:
At 5% significance level and n-1 =24 degrees of freedom, the critical value of t for right tailed test is tcrit =1.711
So, the rejection region is as shown below:
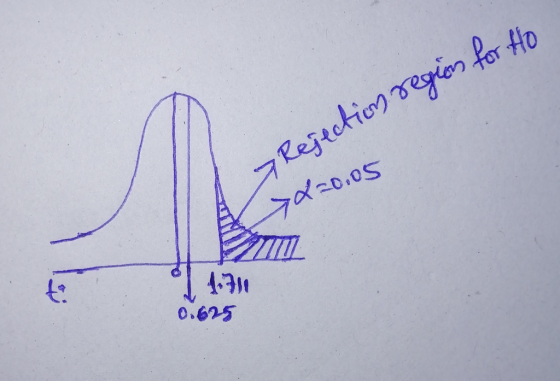
The p-value of the test statistic of t= 0.625 with 24 degrees of freedom for one-tailed test (right tailed) is p =0.269.
7. Conclusion:
We failed to reject the null hypothesis at 0.05 significance level because the test statistic of 0.625 didnot fall in the rejection region.
Also, p-value of the test statistic is p =0.269 > 0.05 significance level. So, we failed to reject the null hypothesis.
Thus, we do not have sufficient evidence to claim that the mean sales for all stores is at least $52,000.
b.
Let the population proportion =P
1. Null Hypothesis(H0):
2. Alternative Hypothesis(H1):
(left-tailed test)
3. Set significance level:
4. Collect data:
Let the Sample size, n= 36; Sample proportion, p =0.42 and so,
Standard error of sample proportion, S.E(p) =
=
=0.0823
5. Test statistic:
Z =(p - P)/S.E = (0.42 - 0.55)/0.0823 = -1.58
6. Rejection region and p-value:
At 5% significance level, for left-tailed test, the critical value of Z is Zcrit = -1.645
So, the rejection region is as follows:
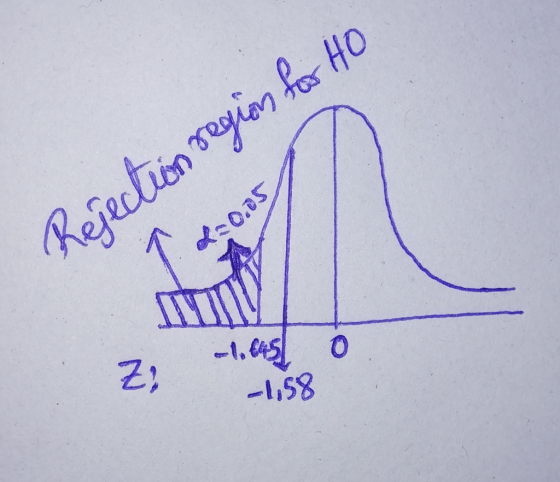
The p-value for one tailed test (left-tailed) for the test statistic of Z = -1.58 is p =0.057
7. Conclusion:
We failed to reject the null hypothesis at 0.05 significance level because the test statistic of -1.58 did not fall in the rejection region. Also, p-value of 0.057 > 0.05 significance level. So, we failed to reject the null hypothesis.
Thus, there is no sufficient evidence to claim that the proportion(P) of stores with a medium market size is less than 55%.
c. and d. are similar to a.
That is, c. and d. both are right tailed tests.
Add Answer to:
Math533 Keller graduate university Project B
Complete the following four hypotheses, using α = 0.05 for...
Complete the following four hypotheses, using α = 0.05 for each. a. Mean sales for all...
Complete the following four hypotheses, using α = 0.05 for each. a. Mean sales for all stores is at least $52,000 (Mean sales = $53,332.8, standard dev = 21,448.14, n = 100) b. Proportion of stores with a medium market size is less than 55% (Medium market size n = 52, market size = 100) c. Mean sales for promotion #3 is more than $45,000 per week (Mean sales for promo 3 = $61,899.38, n = 48, standard dev =...
Complete the following four hypotheses, using α = 0.05 for each. The week 5 spreadsheet can...
Complete the following four hypotheses, using α = 0.05 for each. The week 5 spreadsheet can be used in these analyses. 1. Mean sales per week exceed 42.5 per salesperson 2. Proportion receiving online training is less than 55% 3 Mean calls made among those with no training is at least 145 4. Mean time per call is 14.7 minutes Using the same data set from part A, perform the hypothesis test for each speculation in order to see if...
PLEASE USE THE BELOW GIVEN DATA TO SOLVE THIS PROBLEM. INCLUDING THE BRIEF REPORT. THANK YOU....
 PLEASE USE THE BELOW GIVEN DATA TO SOLVE THIS PROBLEM. INCLUDING
THE BRIEF REPORT.
THANK YOU.
Sales (Y)
Calls (X1)
Time (X2)
Years (X3)
Type
47
167
12.9
5
ONLINE
47
167
16.1
5
ONLINE
44
165
14.2
5
GROUP
43
137
16.6
4
NONE
34
184
12.5
4
GROUP
36
173
14.3
4
GROUP
44
160
14.1
4
NONE
34
132
18.2
4
NONE
48
182
14.1
4
ONLINE
41
158
13.8
4
GROUP
38
163
10.8
4
GROUP...
PLEASE USE THE BELOW GIVEN DATA TO SOLVE THIS PROBLEM. INCLUDING
THE BRIEF REPORT.
THANK YOU.
Sales (Y)
Calls (X1)
Time (X2)
Years (X3)
Type
47
167
12.9
5
ONLINE
47
167
16.1
5
ONLINE
44
165
14.2
5
GROUP
43
137
16.6
4
NONE
34
184
12.5
4
GROUP
36
173
14.3
4
GROUP
44
160
14.1
4
NONE
34
132
18.2
4
NONE
48
182
14.1
4
ONLINE
41
158
13.8
4
GROUP
38
163
10.8
4
GROUP...
Hypothesis Problems For the following hypothesis tests: a. State the null (Ho) and alternative (Hi) hypotheses b. State the type of test (right-tailed, left-tailed, or two-tailed) c. State the m...
 Hypothesis Problems For the following hypothesis tests: a. State the null (Ho) and alternative (Hi) hypotheses b. State the type of test (right-tailed, left-tailed, or two-tailed) c. State the multiplier for an a (level of significance) of .05. The Chamber of Commerce states that only 15% of Boston tourists stay more than 2 days. A new chamber employee feels that the percentage staying more than 2 days is greater than 15%, and plans to sample a set of tourists to...
 PLEASE USE THE BELOW GIVEN DATA TO SOLVE THIS PROBLEM. INCLUDING
THE BRIEF REPORT.
THANK YOU.
Sales (Y)
Calls (X1)
Time (X2)
Years (X3)
Type
47
167
12.9
5
ONLINE
47
167
16.1
5
ONLINE
44
165
14.2
5
GROUP
43
137
16.6
4
NONE
34
184
12.5
4
GROUP
36
173
14.3
4
GROUP
44
160
14.1
4
NONE
34
132
18.2
4
NONE
48
182
14.1
4
ONLINE
41
158
13.8
4
GROUP
38
163
10.8
4
GROUP...
PLEASE USE THE BELOW GIVEN DATA TO SOLVE THIS PROBLEM. INCLUDING
THE BRIEF REPORT.
THANK YOU.
Sales (Y)
Calls (X1)
Time (X2)
Years (X3)
Type
47
167
12.9
5
ONLINE
47
167
16.1
5
ONLINE
44
165
14.2
5
GROUP
43
137
16.6
4
NONE
34
184
12.5
4
GROUP
36
173
14.3
4
GROUP
44
160
14.1
4
NONE
34
132
18.2
4
NONE
48
182
14.1
4
ONLINE
41
158
13.8
4
GROUP
38
163
10.8
4
GROUP...
 Hypothesis Problems For the following hypothesis tests: a. State the null (Ho) and alternative (Hi) hypotheses b. State the type of test (right-tailed, left-tailed, or two-tailed) c. State the multiplier for an a (level of significance) of .05. The Chamber of Commerce states that only 15% of Boston tourists stay more than 2 days. A new chamber employee feels that the percentage staying more than 2 days is greater than 15%, and plans to sample a set of tourists to...
Most questions answered within 3 hours.
-
The specific radiocarbon activity of a sample of wood is 6.25
gms dpm/gm of carbon. The...
asked 45 seconds from now -
An aqueous magnesium chloride solution is made by dissolving
6.96 moles of MgCl2 in sufficient water...
asked 1 minute ago -
Ken believes the average age of men who come to get a haircut at
his barber...
asked 23 minutes ago -
(Ratio Analysis): Last year Co. XYZ had sales of $ 400,000, with
“cost of goods sold”...
asked 32 minutes ago -
can someone please write the balanced chemical
equation for the synthesis of Bromoacetanilide
from;
aniline +...
asked 28 minutes ago -
1. If a corporation purchases land and building and subsequently
tears down the building and uses...
asked 39 minutes ago -
Consider a 23-year bond with 7 percent annual coupon payments.
The market rate (YTM) is 6.4...
asked 42 minutes ago -
a tuba creates a 4th harmonic of frequency 116.5 Hz. what is the
frequency of the...
asked 48 minutes ago -
A coconut mass 2kg falls from a 30m tall tree. The coconut falls
and comes to...
asked 51 minutes ago -
Group Policies
Research GROUP POLICY OBJECTS (GPO'S)
You can start in the Windows Server 2012 eBook...
asked 55 minutes ago -
software engineering
Problems.
Create a use case diagram for class registration for a
university.
Create a...
asked 55 minutes ago -
You are trying to convince your friend who wants to attend
medical school to take BY123...
asked 1 hour ago