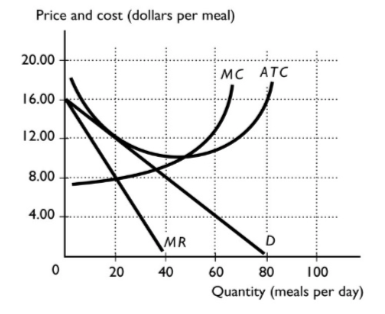
1) The above figure definitely shows
a) a long-run equilibrium for a monopolistically competitive
firm.
b) an industry with few firms.
c) a long-run equilibrium for a perfectly competitive firm.
d) a long-run equilibrium for a perfectly competitive market.
2) The firm in the above figure has a markup of ________ per meal.
a) $0
b) $4
c) $8
d) $10
3) According to the graph bellow:

Q1 to Q2 // Q2 to Q3 // Q4 to Q5
a) The firm experiences economies of scale if it changes its level of output from ......
b) The firm experiences constant returns to scale if it changes its level of output from ......
c) The firm experiences diseconomies of scale if it changes its level of output from ......
Homework Answers
1. Ans - a) a long-run equilibrium for a monopolistically competitive firm.
2. Ans - b) $4
Explanation:
markup = 12- 8 = $4 per meal [ Price - MC]
3.
a) The firm experiences economies of scale if it changes its level of output from Q1 to Q2 ( because the average cost is falling as output rising)
b) The firm experiences constant economies of scale if it changes its level of output from Q2 to Q3 ( because the Average cost remain same or constant as output increases).
c) The firm experiences dis-economies of scale if it changes its level of output from Q4 toQ5 ( because Average cost rising as output rises).
Add Answer to:
1) The above figure definitely shows
a) a long-run equilibrium for a monopolistically competitive
firm.
b)...
Part 1. 1. Use the figure above to answer this question. Consider a perfectly competitive market experiencing good time...
 Part 1.
1. Use the figure above to answer this question.
Consider a perfectly competitive market experiencing good times.
Figure ________ shows a firm maximizing profit in the LONG RUN
because it produces ________ units and makes an economic profit of
________.
A) A; 100; $2 per unit
B) A; 90; $3 per unit
C) B; 100; $0 per unit
D) C; 100; $3 per unit
Part 2.
2. The figure above shows a firm's demand and marginal
revenue curves...
Part 1.
1. Use the figure above to answer this question.
Consider a perfectly competitive market experiencing good times.
Figure ________ shows a firm maximizing profit in the LONG RUN
because it produces ________ units and makes an economic profit of
________.
A) A; 100; $2 per unit
B) A; 90; $3 per unit
C) B; 100; $0 per unit
D) C; 100; $3 per unit
Part 2.
2. The figure above shows a firm's demand and marginal
revenue curves...
In a monopolistically competitive market: There are few firms, each producing a very differentiated product...
 In a monopolistically competitive market: There are few firms, each producing a very differentiated product. There is one firm that produces a standardized product. There are many firms producing a differentiated product. There are market participants who are all price takers. In a perfectly competitive model all the following are assumed, except: patents and copyrights that serve as barriers to entry into the industry. a large number of buyers. standardized product. easy entry to and exit from the market. In...
The figure is drawn for a monopolistically competitive firm. MC ATC 140 123.33 8 PRICE Demand...
 The figure is drawn for a monopolistically competitive firm. MC ATC 140 123.33 8 PRICE Demand 90 56.67 MR 100 133.33 QUANTITY Refer to Figure 16-5. The quantity of output at which the MC and ATC curves cross is the long-run equilibrium quantity of output for the firm. short-run equilibrium quantity of output for the firm. efficient scale of the firm. profit-maximizing quantity.
A monopolistically competitive sneaker firm is currently in long run equilibrium. Graph the firm in long...
A monopolistically competitive sneaker firm is currently in long run equilibrium. Graph the firm in long run equilibrium. Be sure to label all of the curves and the profit-maximizing price and quantity. The price of rubber decreases. Rubber is a major component in the production of sneakers. Draw a new graph that shows the change in the profit maximizing price and quantity of sneakers. Be sure to shade the area of loss or profit.
1. A monopolistically competitive sneaker firm is currently in long run equilibrium. a. Graph the firm...
1. A monopolistically competitive sneaker firm is currently in long run equilibrium. a. Graph the firm in long run equilibrium. Be sure to label all of the curves and the profit-maximizing price and quantity. b. The price of rubber decreases. Rubber is a major component in the production of sneakers. Draw a new graph that shows the change in the profit maximizing price and quantity of sneakers. Be sure to shade the area of loss or profit. .
In the long run, a monopolistically competitive firm will O Produce where price equals average cost....
 In the long run, a monopolistically competitive firm will O Produce where price equals average cost. Earn an economic profit O Produce a greater output level than would a perfectly competitive firm Suffer a loss because of its advertising budget
In comparing the long-run equilibrium of a monopolistically competitive firm and a perfectly competitive firm, which...
 In comparing the long-run equilibrium of a monopolistically competitive firm and a perfectly competitive firm, which of the following is incorrect? Select one: a. they both produce at the minimum point of the average cost curve ob. the both produce at point where price equals average costs c. they both produce where MR = MC od. the both make zero economic profits e. none of the above. o
Suppose there is a monopolistically competitive market with n identical firms, such that each firm produces the same quantity, q. Further, the market is in the monopolistically competitive long-run e...
 Suppose there is a monopolistically competitive market with n identical firms, such that each firm produces the same quantity, q. Further, the market is in the monopolistically competitive long-run equilibrium. You are given the following: Inverse market demand: P 10-Q Total market output: Qnxq Marginal revenue: MR 10n+ 1)xq Total cost: C(q)-5+q Marginal cost: MC 2xq In long-run equilibrium, each firm earns zero economic profit. In long-run equilibrium, the number of firms, n, is and each firm produces units) of...
(Click to select) economies of scale a. Long-run average total cost falls as the firm realize: rises when the firm...
 (Click to select) economies of scale a. Long-run average total cost falls as the firm realize: rises when the firm experiences [ (Click to select) diseconomies of scale diminishing marginal returns increasing marginal returns b. The minimum efficient scale is the level of output produced by the smallest firm in the industry. smallest level of output at which a firm can produce. only level of output where long-run average total costs are minimized. smallest level of output needed to attain...
The figure shows the demand and cost curves for a monopolistically competitive firm in the long...
 The figure shows the demand and cost curves for a monopolistically competitive firm in the long run. The maximum economic profit this firm can earn equal equals O A. $160. B. $80. OC. $0. OD. $120. MC ATC Price and costs (dollars per unit) MR 4 8 12 16 20 24 Quantity (units per day)
 Part 1.
1. Use the figure above to answer this question.
Consider a perfectly competitive market experiencing good times.
Figure ________ shows a firm maximizing profit in the LONG RUN
because it produces ________ units and makes an economic profit of
________.
A) A; 100; $2 per unit
B) A; 90; $3 per unit
C) B; 100; $0 per unit
D) C; 100; $3 per unit
Part 2.
2. The figure above shows a firm's demand and marginal
revenue curves...
Part 1.
1. Use the figure above to answer this question.
Consider a perfectly competitive market experiencing good times.
Figure ________ shows a firm maximizing profit in the LONG RUN
because it produces ________ units and makes an economic profit of
________.
A) A; 100; $2 per unit
B) A; 90; $3 per unit
C) B; 100; $0 per unit
D) C; 100; $3 per unit
Part 2.
2. The figure above shows a firm's demand and marginal
revenue curves...
 In a monopolistically competitive market: There are few firms, each producing a very differentiated product. There is one firm that produces a standardized product. There are many firms producing a differentiated product. There are market participants who are all price takers. In a perfectly competitive model all the following are assumed, except: patents and copyrights that serve as barriers to entry into the industry. a large number of buyers. standardized product. easy entry to and exit from the market. In...
 The figure is drawn for a monopolistically competitive firm. MC ATC 140 123.33 8 PRICE Demand 90 56.67 MR 100 133.33 QUANTITY Refer to Figure 16-5. The quantity of output at which the MC and ATC curves cross is the long-run equilibrium quantity of output for the firm. short-run equilibrium quantity of output for the firm. efficient scale of the firm. profit-maximizing quantity.
 In the long run, a monopolistically competitive firm will O Produce where price equals average cost. Earn an economic profit O Produce a greater output level than would a perfectly competitive firm Suffer a loss because of its advertising budget
 In comparing the long-run equilibrium of a monopolistically competitive firm and a perfectly competitive firm, which of the following is incorrect? Select one: a. they both produce at the minimum point of the average cost curve ob. the both produce at point where price equals average costs c. they both produce where MR = MC od. the both make zero economic profits e. none of the above. o
 Suppose there is a monopolistically competitive market with n identical firms, such that each firm produces the same quantity, q. Further, the market is in the monopolistically competitive long-run equilibrium. You are given the following: Inverse market demand: P 10-Q Total market output: Qnxq Marginal revenue: MR 10n+ 1)xq Total cost: C(q)-5+q Marginal cost: MC 2xq In long-run equilibrium, each firm earns zero economic profit. In long-run equilibrium, the number of firms, n, is and each firm produces units) of...
 (Click to select) economies of scale a. Long-run average total cost falls as the firm realize: rises when the firm experiences [ (Click to select) diseconomies of scale diminishing marginal returns increasing marginal returns b. The minimum efficient scale is the level of output produced by the smallest firm in the industry. smallest level of output at which a firm can produce. only level of output where long-run average total costs are minimized. smallest level of output needed to attain...
 The figure shows the demand and cost curves for a monopolistically competitive firm in the long run. The maximum economic profit this firm can earn equal equals O A. $160. B. $80. OC. $0. OD. $120. MC ATC Price and costs (dollars per unit) MR 4 8 12 16 20 24 Quantity (units per day)
Most questions answered within 3 hours.
-
How much 0.1200 M sodium hydroxide solution is need to titrate
14 mL of a 0.100...
asked 15 seconds ago -
The Poseidon Swim Company produces swim trunks. The average
selling price for one of their swim...
asked 20 minutes ago -
If the elasticity of supply of a good is ∞, then its
A. supply curve is...
asked 6 minutes ago -
An impulse is a change in momentum usually over
a short time. For which of the...
asked 4 minutes ago -
Write an application for the Shady Rest Hotel; the program
determines the price of a room....
asked 10 minutes ago -
USE THE FOLLOWING INFORMATION TO ANSWER THE NEXT (6)
QUESTIONS:
The following is a December 31,...
asked 27 minutes ago -
Suppose you plan to invest $5,000 each year (beginning at the
end of this year) into...
asked 17 minutes ago -
What is the cell potential of the following cell at 25
oC? Note Au is a...
asked 18 minutes ago -
DNA to Protein
Describe the mutation that created the HbS allele:
type of mutation, location of...
asked 24 minutes ago -
1a)When a 5000-kg roller coaster train full of riders approaches
the loading dock at a speed...
asked 24 minutes ago -
Which attribute allows you to specify a custom "thumbnail" for
multimedia elements?
asked 24 minutes ago -
1. Why are the advantages and disadvantages of object-oriented
databases? 2. What are data marts? How...
asked 43 minutes ago