


Homework Answers

 =
= 

 =
= 


Add Answer to:
Suppose the following data represent the heights (in inches) of a random sample of males: 64,...
Suppose the following data represent the heights (in inches) of a random sample of males: 6565, 6767, 6969, 7070, 7272, 7373. Which of the following could be a possible bootstrap sample? (a)...
Suppose the following data represent the heights (in inches) of a random sample of males: 6565, 6767, 6969, 7070, 7272, 7373. Which of the following could be a possible bootstrap sample? (a) 65 comma 69 comma 69 comma 74 comma 72 comma 7265, 69, 69, 74, 72, 72 (b) 73 comma 69 comma 67 comma 72 comma 69 comma 7373, 69, 67, 72, 69, 73 (c) 67 comma 65 comma 67 comma 73 comma 7267, 65, 67, 73, 72 (d)...
Suppose the following data represent the heights (in inches) of a random sample of males: 63,65,67,70,73,74....
Suppose the following data represent the heights (in inches) of a random sample of males: 63,65,67,70,73,74. Which of the following could be a possible bootstrap sample? (a) 63, 72, 70, 65, 73, 63 (b) 67, 65, 65, 67, 73, 65 (c) 73, 63, 73, 65, 73, 65, 73 (d) 67, 70, 67, 74, 67, 74 (e) 63,73,73,73,73
Listed below are speeds (mi/h) measured from traffic on a busy highway. This simple random sample...
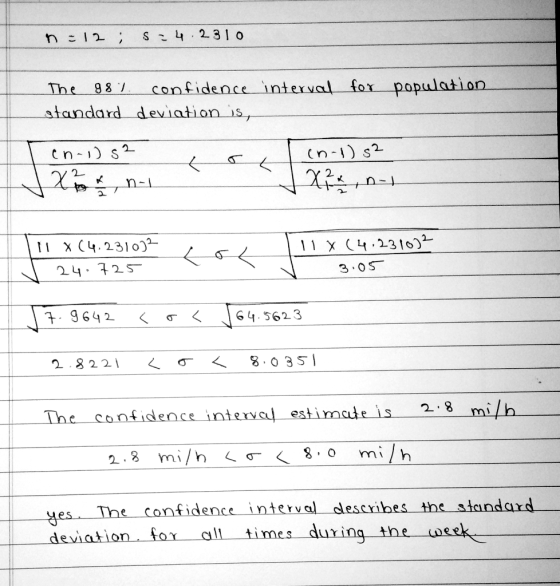
Listed below are speeds (mi/h) measured from traffic on a busy highway. This simple random sample was obtained at 3:30 P.M. on a weekday. Use the sample data to construct a 98% confidence interval estimate of the population standard deviation. 60 65 65 55 65 55 59 58 59 69 62 66. The confidence interval estimate is ____ mi/hless thansigmaless than _____ mi/h. (Round to one decimal place as needed.)
A randomly selected sample of college baseball players has the following heights in inches. 68, 63,...
A randomly selected sample of college baseball players has the following heights in inches. 68, 63, 66, 63, 68, 63, 65, 66, 65, 67, 65, 65, 69, 71, 65, 70, 61, 66, 69, 62, 65, 64, 70, 63, 71, 63, 68, 68, 62, 71, 62, 65 Compute a 95% confidence interval for the population mean height of college baseball players based on this sample and fill in the blanks appropriately. < μ < (Keep 3 decimal places)
Listed below are speeds (mi/h) measured from traffic on a busy highway. This simple random sample was obtained at 3:3...
 Listed below are speeds (mi/h) measured from traffic on a busy highway. This simple random sample was obtained at 3:30 P.M. on a weekday. Use the sample data to construct a 98% confidence interval estimate of the population standard deviation. 65 62 62 56 62 54 60 59 60 69 61 67 Click the icon to view the table of Chi-Square critical values. mi/h. The confidence interval estimate is mi/h (Round to one decimal place as needed.) Does the confidence...
A randomly selected sample of college football players has the following heights in inches. 67, 63,...
A randomly selected sample of college football players has the following heights in inches. 67, 63, 66, 63, 62, 63, 62, 65, 69, 61, 68, 63, 64, 68, 66, 64, 66, 70, 68, 65, 62, 66, 68, 62, 67, 66, 70, 71, 62, 64, 67, 62 Compute a 99% confidence interval for the population mean height of college football players based on this sample and fill in the blanks appropriately. A= ___< μ <___ (Keep 3 decimal places)
Listed below are speeds (mi/h) measured from traffic on a busy highway. This simple random sample...
Listed below are speeds (mi/h) measured from traffic on a busy highway. This simple random sample was obtained at 3:30 P.M. on a weekday. Use the sample data to construct 95% confidence interval estimate of the population standard deviation. 60 61 61 57 61 53 59 58 59 68 62 66 The confidence interval estimate is ______ mi/h
The data table contains frequency distribution of the heights of the players in a basketball league....
 The data table contains frequency distribution of the heights of the players in a basketball league. a. Calculate the mean and standard deviation of this population. b. What is the probability that a sample mean of 40 players will be less than 69.5 in.? c. What is the probability that a sample mean of 40 players will be more than 71 in.? d. What is the probability that a sample mean of 40 players will be between 70 and 71.5...
Listed below are speeds? (mi/h) measured from traffic on a busy highway. This simple random sample...
Listed below are speeds? (mi/h) measured from traffic on a busy highway. This simple random sample was obtained at? 3:30 P.M. on a weekday. Use the sample data to construct a 90?% confidence interval estimate of the population standard deviation. 62 61 61 57 61 54 59 58 59 68 58 69 what is is the CI estimate?
me Listed below are speeds (mi/h) measured from traffic on a busy highway. This simple random...
 me Listed below are speeds (mi/h) measured from traffic on a busy highway. This simple random sample was obtained at 3.30 PM. on a weekday. Use the sample data to construct a 90% confidence interval estimate of the population standard deviation ements 59 59 69 58 66 D 61 56 52 58 62 61 61 ments Click the icon to view the table of Chi-Square critical values. Plan The confidence interval estimate is mih<a mih debook (Round to one decimal...
 Listed below are speeds (mi/h) measured from traffic on a busy highway. This simple random sample was obtained at 3:30 P.M. on a weekday. Use the sample data to construct a 98% confidence interval estimate of the population standard deviation. 65 62 62 56 62 54 60 59 60 69 61 67 Click the icon to view the table of Chi-Square critical values. mi/h. The confidence interval estimate is mi/h (Round to one decimal place as needed.) Does the confidence...
 The data table contains frequency distribution of the heights of the players in a basketball league. a. Calculate the mean and standard deviation of this population. b. What is the probability that a sample mean of 40 players will be less than 69.5 in.? c. What is the probability that a sample mean of 40 players will be more than 71 in.? d. What is the probability that a sample mean of 40 players will be between 70 and 71.5...
 me Listed below are speeds (mi/h) measured from traffic on a busy highway. This simple random sample was obtained at 3.30 PM. on a weekday. Use the sample data to construct a 90% confidence interval estimate of the population standard deviation ements 59 59 69 58 66 D 61 56 52 58 62 61 61 ments Click the icon to view the table of Chi-Square critical values. Plan The confidence interval estimate is mih<a mih debook (Round to one decimal...
Most questions answered within 3 hours.
-
Find the expected value E(X), the variance Var(X) and the
standard deviation σ(X) for each of...
asked 1 hour ago -
home / study / science / physics / physics questions and answers
/ 2. an object...
asked 16 minutes ago -
What do you think every computer science department must teach,
concerning the fact that technology rapidly...
asked 13 minutes ago -
An open cart is travelling at constant speed on a level surface.
A load of coal...
asked 19 minutes ago -
A ski-jumper leaves the ski track moving in the horizontal
direction with a speed of 25.0...
asked 28 minutes ago -
A commercial lubricant, Dubdeefordy, has K = SN/SM = 13.1 for
immiscible solvent M and N....
asked 51 minutes ago -
Are there any potential drawback to the job-crafting approach?
If so, how can they be minimized?
asked 28 minutes ago -
12. To accommodate growth until a new version of IP could be
standardized and adopted, a...
asked 33 minutes ago -
Create a separation scheme flow chart/diagram to isolate methyl
salicylate from a product mixture containing the...
asked 33 minutes ago -
5. The animals of which phylum use a water vascular system in
locomotion, feeding and gas...
asked 59 minutes ago -
*HOW DO I CHANGE THIS FROM A VOID FUNCTION TO A NON-VOID
WITH PARAMETERS?*
#include<iostream>
#include<fstream>...
asked 47 minutes ago -
I have a matrix, A= rand(2,3,2) ans(:,:,1) = 0.8116 0.3507
0.8759 0.5328 0.9390 0.5502 ans(:,:,2) =...
asked 50 minutes ago