
Homework Answers


Add Answer to:
The following table gives the joint probability distribution between employment status and college graduation among those...
The following table gives the joint probability distribution between employment status and college graduation among those...
The following table gives the joint probability distribution between employment status and college graduation among those either employed or looking for work (unemployed) in the working-age U.S. Population for 2012. Unemployed (Y=0) Employed (Y=1) Total Non-college grads(X=0) 0.045 0.590 0.635 College grads(X=1) 0.015 0.350 0.365 Total 0.060 0.940 1.000 a. Compute E(Y). b. Compute E(X). c. Compute Var(Y). d. Compute Var(X). e. Compute Cov(X,Y). f. [Compute Corr(X,Y). g. The unemployment rate is the fraction of the labor force that is...
The following table gives the joint probability distribution between employment status and college graduation among those...
 The following table gives the joint probability distribution between employment status and college graduation among those either employed or looking for work (unemployed) in the working-age U.S. population for September 2017 Unemployed (Y=0) 0.026 Employed (Y=1) 0.576 Non-college grads (X=0) College Grads (X=1) 0.009 0.389 a) Compute marginal probabilities of X and Y. b) Compute E(Y) and E(X) c) Calculate E(YIX=1) and E(YIX=0) d) A randomly selected member of this population reports being unemployed. What is the probability that this...
The following table gives the joint probability distribution between employment status & college graduation in the...
The following table gives the joint probability distribution between employment status & college graduation in the US working age population for 2012. Unemployed (Y=0) Employed (Y=1) Total Non-college graduates (X=0) 0.053 0.586 0.639 College graduates (X=1) 0.015 0.346 0.361 Total 0.068 0.932 1 Calculate the unemployment rate for college graduates, & for non-college graduates. A randomly selected member of the population reports being unemployed. What is the probability that they are a college graduate? A non-college graduate? Are educational achievement...
The following table gives the joint probability distribution between employment status and college graduation among those...
 The following table gives the joint probability distribution between employment status and college graduation among those either employed or looking for work (unemployed). Answer questions 36-40. Non-college grads (Y=0) College grads (Y=1) Total Unemployed X=0) Employed X1 Total 0.024 021120 16 0.105 0.456 0.564 0132 0.868 1.000 Table 2: Joint Distribution of Employment Status and College Graduation 36. Compute E(Y) (a) 0.466 (b) 0.564 (c) 0.946 (d) 0.534 37. Calculate ElYX = 1). (a) 0.456. (b) 0.490 (e) 0.525. (d)...
Exercise 2.6 The folowing table gves the yont probability distribution between employment status and college graduation...
 Exercise 2.6 The folowing table gves the yont probability distribution between employment status and college graduation among those ether employed or looking for work Question Help Unemployed Employed 0% 0) 0 0708 0 0177 0 0885 (Y 1) 0 6041 3074 Total Non-college grads (X0) College grads X Total 0 3251 1 0005 0 912 The expected vale of Y.denoted EY s0912 (Round your response to three decimal places) The poment rate of hobr frce thats nmompoyed S Show that...
The following table gives the joint probability distribution between employment status and college graduation among those...
 The following table gives the joint probability distribution between employment status and college graduation among those either employed or looking for work (unemployed) in the working-age U.S. population for 2016. | Unemployed (Y = 0) . Employed (Y = 1) Non-college graduates (X- 0 College graduates (X 1) 0.045 0.026 0.621 0.308 (a) Compute the expected value (mean) of X and Y: E(X), E(Y). (b) Compute the variance of X and Y: ơ (c) Compute the covariance and correlation coefficient:...
Exercise 2.6 Question Help * The following table gives the joint probability distribution between employment status...
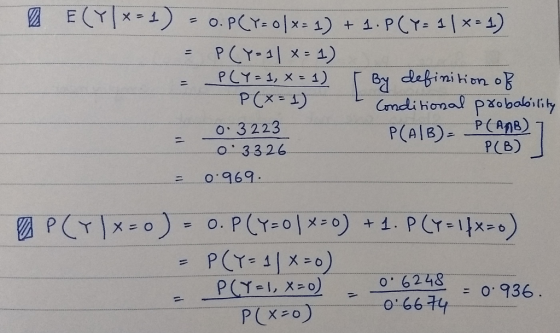
 Exercise 2.6 Question Help * The following table gives the joint probability distribution between employment status and college graduation among those either employed or looking for work (unemployed) in the working age U.S. population Employed (Y 1) 0.5906 0.3142 0.905 Unemployed (Y 0) Non-college grads (X#0) College grads (X# 1) Total Total 0.6672 0.3328 1.0002 0.0186 0.0952 The expected value of Y, denoted E(V.is(Round your response to three decimal places)
The following table gives the joint probability distribution between employment status and college graduation among those...
 The following table gives the joint probability distribution between employment status and college graduation among those either employed or looking for work (unemployed) in the working-age U.S. population for 2016. Suppose there was a data entry error, resulting in an outlier of value 1111. As a result, the joint probability distribution is provided below. (a) Calculate the expected value and variance of X. (b) In words, describe how outliers affect the expected value and variance of X. You may want...
Question 2 (6 points) The following table gives the joint probability distribution between employ- employed or...
 Question 2 (6 points) The following table gives the joint probability distribution between employ- employed or looking tor work ment status and college graduation among those either (unemployed) in the working-age U.S. population for 2012. Joint Distribution of Employment Status and College Graduation in the U.S.Population Aged 25 and Older, 2012 Non-college grads (X- 0) College grads (x-1) Total Unemployed (Y = O) 0.053 0.015 0.068 Employed (Y= 1) 0.586 0.346 0.932 Total 0.639 0.361 1.000 (a) Compute E[Y] (b)...
Question Help Compute the following probabilities: If Y is distributed N (-2.4). Pr (Ys-5)(Round your response...
 Question Help Compute the following probabilities: If Y is distributed N (-2.4). Pr (Ys-5)(Round your response to four decimal places.) or work (unemployed) in the working-age U.S. population for 2012. Joint Distribution of Employment Status and College Graduation in the U.S. Population Aged 25 and Older, 2012 Unemployed Employed (Y 0) Y1) 0.586 0.639 0.361 1.000 Non-college grads (X = 0) 0.015 Total 0.932 a. Compute E(Y). b. The unemployment rate is the fraction of the labor force that is...
 The following table gives the joint probability distribution between employment status and college graduation among those either employed or looking for work (unemployed) in the working-age U.S. population for September 2017 Unemployed (Y=0) 0.026 Employed (Y=1) 0.576 Non-college grads (X=0) College Grads (X=1) 0.009 0.389 a) Compute marginal probabilities of X and Y. b) Compute E(Y) and E(X) c) Calculate E(YIX=1) and E(YIX=0) d) A randomly selected member of this population reports being unemployed. What is the probability that this...
 The following table gives the joint probability distribution between employment status and college graduation among those either employed or looking for work (unemployed). Answer questions 36-40. Non-college grads (Y=0) College grads (Y=1) Total Unemployed X=0) Employed X1 Total 0.024 021120 16 0.105 0.456 0.564 0132 0.868 1.000 Table 2: Joint Distribution of Employment Status and College Graduation 36. Compute E(Y) (a) 0.466 (b) 0.564 (c) 0.946 (d) 0.534 37. Calculate ElYX = 1). (a) 0.456. (b) 0.490 (e) 0.525. (d)...
 Exercise 2.6 The folowing table gves the yont probability distribution between employment status and college graduation among those ether employed or looking for work Question Help Unemployed Employed 0% 0) 0 0708 0 0177 0 0885 (Y 1) 0 6041 3074 Total Non-college grads (X0) College grads X Total 0 3251 1 0005 0 912 The expected vale of Y.denoted EY s0912 (Round your response to three decimal places) The poment rate of hobr frce thats nmompoyed S Show that...
 The following table gives the joint probability distribution between employment status and college graduation among those either employed or looking for work (unemployed) in the working-age U.S. population for 2016. | Unemployed (Y = 0) . Employed (Y = 1) Non-college graduates (X- 0 College graduates (X 1) 0.045 0.026 0.621 0.308 (a) Compute the expected value (mean) of X and Y: E(X), E(Y). (b) Compute the variance of X and Y: ơ (c) Compute the covariance and correlation coefficient:...
 Exercise 2.6 Question Help * The following table gives the joint probability distribution between employment status and college graduation among those either employed or looking for work (unemployed) in the working age U.S. population Employed (Y 1) 0.5906 0.3142 0.905 Unemployed (Y 0) Non-college grads (X#0) College grads (X# 1) Total Total 0.6672 0.3328 1.0002 0.0186 0.0952 The expected value of Y, denoted E(V.is(Round your response to three decimal places)
 The following table gives the joint probability distribution between employment status and college graduation among those either employed or looking for work (unemployed) in the working-age U.S. population for 2016. Suppose there was a data entry error, resulting in an outlier of value 1111. As a result, the joint probability distribution is provided below. (a) Calculate the expected value and variance of X. (b) In words, describe how outliers affect the expected value and variance of X. You may want...
 Question 2 (6 points) The following table gives the joint probability distribution between employ- employed or looking tor work ment status and college graduation among those either (unemployed) in the working-age U.S. population for 2012. Joint Distribution of Employment Status and College Graduation in the U.S.Population Aged 25 and Older, 2012 Non-college grads (X- 0) College grads (x-1) Total Unemployed (Y = O) 0.053 0.015 0.068 Employed (Y= 1) 0.586 0.346 0.932 Total 0.639 0.361 1.000 (a) Compute E[Y] (b)...
 Question Help Compute the following probabilities: If Y is distributed N (-2.4). Pr (Ys-5)(Round your response to four decimal places.) or work (unemployed) in the working-age U.S. population for 2012. Joint Distribution of Employment Status and College Graduation in the U.S. Population Aged 25 and Older, 2012 Unemployed Employed (Y 0) Y1) 0.586 0.639 0.361 1.000 Non-college grads (X = 0) 0.015 Total 0.932 a. Compute E(Y). b. The unemployment rate is the fraction of the labor force that is...
Most questions answered within 3 hours.
-
The average length of time between arrivals at a turnpike
toll-booth is 26 seconds. What is...
asked 1 hour ago -
(a) A piston at 6.1 atm contains a gas that occupies a volume of
3.5 L....
asked 2 hours ago -
Please answer true or false. Words
cannot be changed or added in to make it true...
asked 2 hours ago -
An empty test tube weighs 15.923 grams. Then,
MgCl2•6H2O is added into the test tube. After...
asked 2 hours ago -
Assume memory access is 10 units of time and disk access is
10000 units of time....
asked 2 hours ago -
1. Are all good samples random?
2. Magazines often report surveys giving statistics such as “63%...
asked 3 hours ago -
Under all the various types of market structures, firms
must eventually earn some economic profits for...
asked 2 hours ago -
Consider the following fitness regime for a single locus trait
with two co-dominant alleles: w11 =...
asked 3 hours ago -
A large cable company reports the following.
80% of its customers subscribe to its cable TV...
asked 3 hours ago -
Please answer the question in brief.
Discuss the role of ERP in organizations. Are ERP tools...
asked 3 hours ago -
Discuss the pros and cons of collaborative software such
as SameTime. Does it increase productivity? What...
asked 3 hours ago -
Buying your in-laws a gift because it’s expected is
due to the ____________ motive of gift-giving....
asked 3 hours ago