

Homework Answers

Add Answer to:
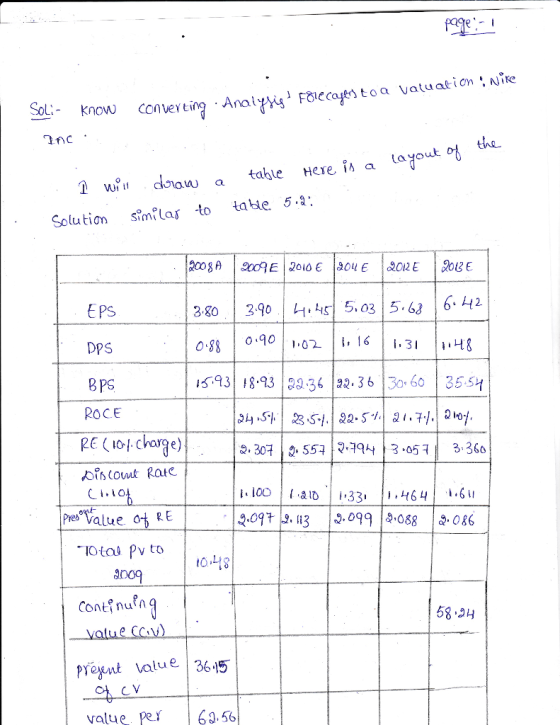
E5.13. Converting Analysts' Forecasts to a Valuation: Nike, Inc. (Medium) Nike reported book value per share...
Consider the following data for Nike Inc : In 2009 it had $19.300 million in sales...
 Consider the following data for Nike Inc : In 2009 it had $19.300 million in sales with a 10% growth rate in 2010, but then slows by 1% to the long-un growth ate of 5% by 2015, Nike expects EBIT to be 10% of sales, increases in net working capital requirements to be 10% of any increases equal depreciation expenses. Nike also has $2.300 million in cash, $32 million in debt, 486 million shares outstanding, a tax rate of 24%,...
3. Consider the following data on company Thor. BV = Book value per share 5.10 ROE...
3. Consider the following data on company Thor. BV = Book value per share 5.10 ROE = Return on equity 18.5% MP = Market price per share 26.29 Normal growth in EPS of 3.5%. Required return on company Thor of 5.7% EPS = Earnings per share 2.75 DPS = Dividends per share 1.25 (this is last year dividend or D0 ) 3A. Calculate the price to book value P/B based on the fair value estimation model. Would you buy or...
Consider the following data for Nike Inc. In 2009 it had $19.100 million n sales with a 10% growt...
 Consider the following data for Nike Inc. In 2009 it had $19.100 million n sales with a 10% growth rate in 2010, but then slows by 1 % to the long-run growth rate of 5% by 2015. Nike expects EBIT to be 10% of sales increases in networking capital requirements to be 10% of any increases in sales and capital expenditures to equal depreciation expenses. Nike also has $2.300 million in cash, $32 million in debt 486 million shares outstanding,...
Janet Ludlow’s firm requires all its analysts to use a two-stage DDM and the CAPM to...
Janet Ludlow’s firm requires all its analysts to use a two-stage DDM and the CAPM to value stocks. Using these measures, Ludlow has valued QuickBrush Company at $63 per share. She now must value SmileWhite Corporation. a. Calculate the required rate of return for SmileWhite using the information in the following table: December 2010 Quick Brush SmileWhite Beta 1.35 1.2 Market Price $45.00 $32 Intrinsic Value $63.00 ? Note: Risk-free rate = 4.5%; expected market return = 16%. Instruction:...
We are examining the stock of Starbooks Inc. The consensus forecast by analysts is that the...
We are examining the stock of Starbooks Inc. The consensus forecast by analysts is that the stock will generate earnings per share of $5 in the next year (EPS1=$5) and will pay $2 dividend per share next year (DPS1=$2). Starbooks maintains an ROE of 20%. The required rate of return on the stock is 16%. We use the Gordon constant growth model in which the constant growth rate is equal to the sustainable growth rate. According to the model, the...
The table below reports the earnings per share of common stock for Home Depot Inc. for...
The table below reports the earnings per share of common stock for Home Depot Inc. for 2003 through 2015. Year Earnings per Share 2003 $ 1.65 2004 1.95 2005 2.35 2006 2.73 2007 2.87 2008 2.42 2009 1.41 2010 1.60 2011 2.10 2012 2.52 2013 3.81 2014 7.14 2015 9.67 Click here for the Excel Data File Develop an index, with 2003 as the base, for earnings per share for years 2004 through 2015. (Round your answers to 1 decimal...
Question 3. 5 Marks Use the residual income valuation model and the forecasts and the other...
 Question 3. 5 Marks Use the residual income valuation model and the forecasts and the other relevant data from the table below to compute equity value per share. 2007 2008 2009 2010 2011 2012 2006 forecast forecast forecast forecast forecast forecast Cost of capital for equity (r.) & discount factors 11.00% 1.110 1.232 1.368 1.518 1.685 1.870 Cost of capital (WACC) and discount factors 10.73% 1.107 1.226 1.358 1.843 RI Model - Terminal value growth rate 2.05% Sales Profit margin...
I need to compute the company’s EPS, Book Value per share, Sales per share based on...
 I need to compute the company’s EPS, Book Value per share, Sales
per share based on its financial information for Costco. (MSN
Money, Analysis/Key Statistics).
EPS = Net Income / Shares Outstanding =
Book Value per Share = Equity / Shares Outstanding =
Sales per Share = Total Revenues / Shares Outstanding =
3 msn money web search Search the web (e.g. Goldman Sachs Savings) Recent Searches: costco powered by Microsoft News Manage History Today Markets Investing Personal Finance Real...
I need to compute the company’s EPS, Book Value per share, Sales
per share based on its financial information for Costco. (MSN
Money, Analysis/Key Statistics).
EPS = Net Income / Shares Outstanding =
Book Value per Share = Equity / Shares Outstanding =
Sales per Share = Total Revenues / Shares Outstanding =
3 msn money web search Search the web (e.g. Goldman Sachs Savings) Recent Searches: costco powered by Microsoft News Manage History Today Markets Investing Personal Finance Real...
Integrative—Risk and valuation Giant Enterprises' stock has a required return of 11.6%. The company, which plans...
 Integrative—Risk and valuation Giant Enterprises' stock has a required return of 11.6%. The company, which plans to pay a dividend of $1.63 per share in the coming year, anticipates that its future dividends will increase at an annual rate consistent with that experienced over 2009-2015 period, when the following dividends were paid: :: a. If the risk-free rate is 8%, what is the risk premium on Giant's stock? b. Using the constant-growth model, estimate the value of Giant's stock. (Hint:...
The following table gives Foust Company's earnings per share for the last 10 years. The common...
 The following table gives Foust Company's earnings per share for the last 10 years. The common stock, 8.2 million shares outstanding, is now (1/1/20) selling for $74.00 per share. The expected dividend at the end of the current year (12/31/20) is 45% of the 2019 EPS. Because investors expect past trends to continue, a may be based on the historical earnings growth rate. (Note that 9 years of growth are reflected in the 10 years of data.) Year EPS Year...
 Consider the following data for Nike Inc : In 2009 it had $19.300 million in sales with a 10% growth rate in 2010, but then slows by 1% to the long-un growth ate of 5% by 2015, Nike expects EBIT to be 10% of sales, increases in net working capital requirements to be 10% of any increases equal depreciation expenses. Nike also has $2.300 million in cash, $32 million in debt, 486 million shares outstanding, a tax rate of 24%,...
 Consider the following data for Nike Inc. In 2009 it had $19.100 million n sales with a 10% growth rate in 2010, but then slows by 1 % to the long-run growth rate of 5% by 2015. Nike expects EBIT to be 10% of sales increases in networking capital requirements to be 10% of any increases in sales and capital expenditures to equal depreciation expenses. Nike also has $2.300 million in cash, $32 million in debt 486 million shares outstanding,...
 Question 3. 5 Marks Use the residual income valuation model and the forecasts and the other relevant data from the table below to compute equity value per share. 2007 2008 2009 2010 2011 2012 2006 forecast forecast forecast forecast forecast forecast Cost of capital for equity (r.) & discount factors 11.00% 1.110 1.232 1.368 1.518 1.685 1.870 Cost of capital (WACC) and discount factors 10.73% 1.107 1.226 1.358 1.843 RI Model - Terminal value growth rate 2.05% Sales Profit margin...
 I need to compute the company’s EPS, Book Value per share, Sales
per share based on its financial information for Costco. (MSN
Money, Analysis/Key Statistics).
EPS = Net Income / Shares Outstanding =
Book Value per Share = Equity / Shares Outstanding =
Sales per Share = Total Revenues / Shares Outstanding =
3 msn money web search Search the web (e.g. Goldman Sachs Savings) Recent Searches: costco powered by Microsoft News Manage History Today Markets Investing Personal Finance Real...
I need to compute the company’s EPS, Book Value per share, Sales
per share based on its financial information for Costco. (MSN
Money, Analysis/Key Statistics).
EPS = Net Income / Shares Outstanding =
Book Value per Share = Equity / Shares Outstanding =
Sales per Share = Total Revenues / Shares Outstanding =
3 msn money web search Search the web (e.g. Goldman Sachs Savings) Recent Searches: costco powered by Microsoft News Manage History Today Markets Investing Personal Finance Real...
 Integrative—Risk and valuation Giant Enterprises' stock has a required return of 11.6%. The company, which plans to pay a dividend of $1.63 per share in the coming year, anticipates that its future dividends will increase at an annual rate consistent with that experienced over 2009-2015 period, when the following dividends were paid: :: a. If the risk-free rate is 8%, what is the risk premium on Giant's stock? b. Using the constant-growth model, estimate the value of Giant's stock. (Hint:...
 The following table gives Foust Company's earnings per share for the last 10 years. The common stock, 8.2 million shares outstanding, is now (1/1/20) selling for $74.00 per share. The expected dividend at the end of the current year (12/31/20) is 45% of the 2019 EPS. Because investors expect past trends to continue, a may be based on the historical earnings growth rate. (Note that 9 years of growth are reflected in the 10 years of data.) Year EPS Year...
Most questions answered within 3 hours.
-
To be done in java code. 2 words are anagrams if 1 word can be
formed...
asked 4 minutes ago -
Bright Sun, Inc. sold an issue of 30-year $1,000 par value bonds
to the public. The...
asked 1 minute ago -
Two players take turns at removing 1 to 4 coins from an original
pile of 16...
asked 1 minute ago -
The income statement for the month of June, 2014 of Happy Smiles
Enterprises contains the following...
asked 7 minutes ago -
1-Calculate the mass in grams of 2.55 moles of KCl
2- Calculate how many moles are...
asked 7 minutes ago -
1. Choose value for p between 0.20 and 0.80. It should have at
least two decimal...
asked 8 minutes ago -
QUESTIONS: 500 words for the question
In defining abnormality, the criteria of “deviance”, “distress”
and “dysfunction”...
asked 10 minutes ago -
A sample of n = 25 scores produces a t statistic of t =
-2.062. If...
asked 28 minutes ago -
Given the following, compute the after tax cost of debt: The par
value of the firms...
asked 21 minutes ago -
Coding in C. Please only use stdio.h (which would mean no malloc
or anything like that)...
asked 27 minutes ago -
Use the fundamental accounting equation to find the missing
amounts.
Scenario
Assets
Liabilities
Equity
1
$...
asked 25 minutes ago -
A population has a mean of 200 and a standard deviation of 60.
Suppose a sample...
asked 29 minutes ago