
Homework Answers
a) The mean, median, and mode of the normal distribution are equal.
The curve of the normal distribution is bell-shaped and is symmetric about the mean.
b) No,wealth or income in Canada is unequally distributed with the top 20% of households owning about 67% of the total wealth and the bottom 20% of households owning less than 1%.
Add Answer to:
a) Mention two properties of a normal distribution. b) Do you think the household income or...
The household income of a large population city has a normal distribution with average of 68,000...
The household income of a large population city has a normal distribution with average of 68,000 and standard deviation of 12,000. A sample of 50 families is selected randomly. WHAT IS THE EXCEL FUNCTION USED? A) What is mean of the sample, variance of the sample, and standard deviation of the sample? b) Approximate the probability that the sample mean of the household income is greater than 80,000. [Requirement: Draw a bell shape graph and identify the mean, cut-off value,...
Need help!! Median household income (in dollars) 39,750 43,669 70,674 54,968 60,859 40,210 45,210 51,639 55,393...
 Need help!!
Median household income (in dollars) 39,750 43,669 70,674 54,968 60,859 40,210 45,210 51,639 55,393 61,441 41,266 47,473 52,806 56,202 62,813 42,116 48,864 53,607 57,469 63,218 42,536 50,255 53,882 60,070 67,658 The accompanying table shows the median household income (in dollars) for 25 randomly selected regions. Complete parts (a) through (g) below. Click the icon to view the table of data. (a) Construct a frequency distribution. Use a first class having a lower class limit of 35,000 and a...
Need help!!
Median household income (in dollars) 39,750 43,669 70,674 54,968 60,859 40,210 45,210 51,639 55,393 61,441 41,266 47,473 52,806 56,202 62,813 42,116 48,864 53,607 57,469 63,218 42,536 50,255 53,882 60,070 67,658 The accompanying table shows the median household income (in dollars) for 25 randomly selected regions. Complete parts (a) through (g) below. Click the icon to view the table of data. (a) Construct a frequency distribution. Use a first class having a lower class limit of 35,000 and a...
Which of the following statements is not a property of the normal probability distribution?
Which of the following statements is not a property of the normal probability distribution?A. The normal distribution is symmetricB. Exactly two-thirds of all possible observed values of the random variable x are within plus or minus one standard deviations of the population meanC. The mean, median and mode are equalD. The area under the normal curve to the right of the mean is equal to the area under the normal curve to the left of the meanE. All of the...
b) Consider the following data on grades received by a student in a particular course. Weight...
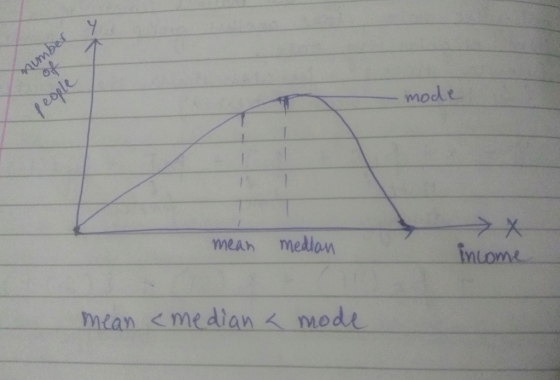
 b) Consider the following data on grades received by a student in a particular course. Weight 25% o.zg 3096 o.3c 45% ,45 Tests Grades est145 Test 2 50 Final Exam: 65 Compute the weighted average of grades 3a) In 2015, the median total income of households in Greater Sudbury was $71,687 while the mean income was $89,941. Show in a diagram, the likely shape of income distribution with approximate locations of the mean, median, and mode.
3. Explain all the basic properties of the model of the normal distribution. 4. In a...
 3. Explain all the basic properties of the model of the normal distribution. 4. In a factory, the length of a certain metal bar is normally distributed, and has a mean of 50 cm, and a standard deviation of 0.07 cm. Two bars are selected and the measurements are 50.05cm and 49.99 cm. To calculate the probability that the length falls between 50.05 and 49.99, we need to standardize the normal distribution by calculating the z- scores. What are the...
1. Expand the following: a) Σ ( a + b%) where i varies from 1 to...
 1. Expand the following: a) Σ ( a + b%) where i varies from 1 to n. b) ( Σ up where i varies from 1 to 3. 2a) Define the arithmetic mean, mode, and the median. MeaR b) Consider the following data on grades received by a student in a particular course Weight 25% o 30% .30 45% , Tests Grades Test145 Test 2: 50 Final Exam: 65 Compute the weighted average of grades. 3 a) In 2015, the...
The distribution of the annual income of mid-management at Everbright Battery approximates a normal distribution with...
 The distribution of the annual income of mid-management at Everbright Battery approximates a normal distribution with a mean of $75,000 and a standard deviation of $1,500 a. 68% lie between +16 from the mean => b. 95 % lie between 20 from the mean => c. Virtually all, but not totally all, is between 30 from the mean => d. Can the median and mode income be the same as the mean? e. Is the distribution symmetrical? f. Approximately, what...
PLEASE ANSWER ALL THE FOLLOWING QUESTIONS: 1) What shape would you expect for the distribution of...
PLEASE ANSWER ALL THE FOLLOWING QUESTIONS: 1) What shape would you expect for the distribution of scores from a very hard exam for a large class of students? a) positively skewed b) negatively skewed c) symmetrical d) normal 2) A distribution is positively skewed. Which is the most probable order for the three measures of central tendency? a) mean = 60, median = 50, mode = 40 b) mean = 40, median = 50, mode = 60 c) mean =...
What is normal? Can you think of where you see the normal distribution in your day...
What is normal? Can you think of where you see the normal distribution in your day to day life? Suppose we collect data on the height of all of us in this class. What would the graph look like? Would it be bell-shaped? The normal distribution is vital to statistical analysis, being fully defined by the mean and standard deviation. All normal curves have the same general shape. 68% of the total area under the curve is from +1 to...
6. Properties of the normal curve Aa Aa The following figure shows the normal distribution with...
 6. Properties of the normal curve Aa Aa The following figure shows the normal distribution with the proportion of the area under the normal curve contained within one, two, and three standard deviations of the mean. The last proportion on each side, 0.13%, depicts the remaining area under the curve. Specifically, 0.13% of the area under the standard normal distribution is located above z-score values greater than the mean (H) plus three standard deviations (+30). Also, because the normal distribution...
 Need help!!
Median household income (in dollars) 39,750 43,669 70,674 54,968 60,859 40,210 45,210 51,639 55,393 61,441 41,266 47,473 52,806 56,202 62,813 42,116 48,864 53,607 57,469 63,218 42,536 50,255 53,882 60,070 67,658 The accompanying table shows the median household income (in dollars) for 25 randomly selected regions. Complete parts (a) through (g) below. Click the icon to view the table of data. (a) Construct a frequency distribution. Use a first class having a lower class limit of 35,000 and a...
Need help!!
Median household income (in dollars) 39,750 43,669 70,674 54,968 60,859 40,210 45,210 51,639 55,393 61,441 41,266 47,473 52,806 56,202 62,813 42,116 48,864 53,607 57,469 63,218 42,536 50,255 53,882 60,070 67,658 The accompanying table shows the median household income (in dollars) for 25 randomly selected regions. Complete parts (a) through (g) below. Click the icon to view the table of data. (a) Construct a frequency distribution. Use a first class having a lower class limit of 35,000 and a...
 b) Consider the following data on grades received by a student in a particular course. Weight 25% o.zg 3096 o.3c 45% ,45 Tests Grades est145 Test 2 50 Final Exam: 65 Compute the weighted average of grades 3a) In 2015, the median total income of households in Greater Sudbury was $71,687 while the mean income was $89,941. Show in a diagram, the likely shape of income distribution with approximate locations of the mean, median, and mode.
 3. Explain all the basic properties of the model of the normal distribution. 4. In a factory, the length of a certain metal bar is normally distributed, and has a mean of 50 cm, and a standard deviation of 0.07 cm. Two bars are selected and the measurements are 50.05cm and 49.99 cm. To calculate the probability that the length falls between 50.05 and 49.99, we need to standardize the normal distribution by calculating the z- scores. What are the...
 1. Expand the following: a) Σ ( a + b%) where i varies from 1 to n. b) ( Σ up where i varies from 1 to 3. 2a) Define the arithmetic mean, mode, and the median. MeaR b) Consider the following data on grades received by a student in a particular course Weight 25% o 30% .30 45% , Tests Grades Test145 Test 2: 50 Final Exam: 65 Compute the weighted average of grades. 3 a) In 2015, the...
 The distribution of the annual income of mid-management at Everbright Battery approximates a normal distribution with a mean of $75,000 and a standard deviation of $1,500 a. 68% lie between +16 from the mean => b. 95 % lie between 20 from the mean => c. Virtually all, but not totally all, is between 30 from the mean => d. Can the median and mode income be the same as the mean? e. Is the distribution symmetrical? f. Approximately, what...
 6. Properties of the normal curve Aa Aa The following figure shows the normal distribution with the proportion of the area under the normal curve contained within one, two, and three standard deviations of the mean. The last proportion on each side, 0.13%, depicts the remaining area under the curve. Specifically, 0.13% of the area under the standard normal distribution is located above z-score values greater than the mean (H) plus three standard deviations (+30). Also, because the normal distribution...
Most questions answered within 3 hours.
-
After running a regression analysis we calculated an F test and
the significance level was 0.15....
asked 10 seconds ago -
----Can someone please help me solve this one using JAVA
----I thank you in advance
Create...
asked 4 minutes ago -
) Raw materials are studied for contamination. Suppose that
the number of particles of contamination per...
asked 4 minutes ago -
1. What force primarily attracts the potassium ion to
the nitrate ion?
a. London forces...
asked 6 minutes ago -
What are the negative effects of abruptly stopping the use of
all fossil fuels? Give at...
asked 13 minutes ago -
Given that many conflict are the result of different parties having
different interests, is it possible...
asked 18 minutes ago -
A 750 g block can slide uniformly along the horizontal track
when a string attached to...
asked 21 minutes ago -
In 2017, Juan entered into a contract to write a book. The
publisher advanced Juan $50,000,...
asked 34 minutes ago -
Determine the number of kinds of protons in each molecule (w/
respect to NMR spectroscopy). Drawing...
asked 45 minutes ago -
A jeweler whose near point is 68 cm from his eye uses a
magnifying glass as...
asked 43 minutes ago -
A company wants to determine how many units of each of two
products, A and B,...
asked 47 minutes ago -
The blood pressure of a person changes throughout the day.
Suppose the systolic blood pressure of...
asked 55 minutes ago