


Homework Answers
(5)

(6)

The proportion is 0.7107. This is not unusual.
(7)
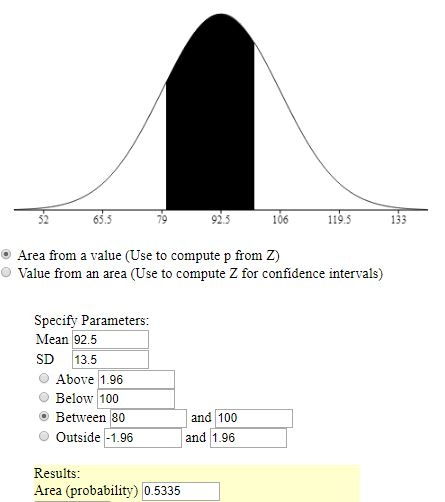
Probability = 0.5335
(8)

The measurements are 70.29 cm and 114.71 cm.
Add Answer to:
A Waist is a Terrible Thing to Mind: The waist circumference of males 20 to 29...
Beview 1JA survey of 700 non-fatal accidents showed that 183 involved faulty equipment. Find a point...
 Beview 1JA survey of 700 non-fatal accidents showed that 183 involved faulty equipment. Find a point estimate for p, the population proportion of accidents that involved faulty equipment. 2) An article a Florida newspaper reported on the topics that teenagers most want to discuss with their pare nts. The findings, the results of a poll, showed that 46% would like more discussion about the family's financial situation, 37% would like to talk about school, and 30% would like to talk...
Researchers wondered if there was a difference between males and females in regard to some common...
 Researchers wondered if there was a difference between males and females in regard to some common annoyances. They asked a random sample of tales and ferrales, the following question: "Are you annoyed by people who repeatedly check their mobile phones while having aan in-person coriversaliun?" Ainung the 580 males surveyed 218 resurideu "Yes", argile 520 fernales surveyed, 212 responded Yes."Dues the eviderice sugges, a higher proportion of females are annoyed by this beliaviar? Cumplete paris (a) through (g) belun. (a)...
Probability and I A recent Gallup Poll asked a simple random sample o cigarettes in the...
 Probability and I A recent Gallup Poll asked a simple random sample o cigarettes in the past week?" Suppose that in fact 20 question. The proportion of the sample who answer this, we simulated 1000 samples of size n=1600 from a populatie smoked cigarettes in the past week. The results of this simula the percentage column and write your answers as decimals done for you as an example.) om sample of 1600 American adults, "Have you, yourself smoked any ose...
Just Need part 4 You will conduct statistical surveys in which you attempt to make a...
 Just Need part 4
You will conduct statistical surveys in which you attempt to make a conclusion about multiple population parameters. Here are the project guidelines: You will use the De Anza College student body as your population You must sample at least 50 students, asking them 2 questions Question #1: This will be an average / 1-population question Question #2: This will be a proportion / 2-population question You must work in groups of 1 to 3 people (You...
Just Need part 4
You will conduct statistical surveys in which you attempt to make a conclusion about multiple population parameters. Here are the project guidelines: You will use the De Anza College student body as your population You must sample at least 50 students, asking them 2 questions Question #1: This will be an average / 1-population question Question #2: This will be a proportion / 2-population question You must work in groups of 1 to 3 people (You...
 Beview 1JA survey of 700 non-fatal accidents showed that 183 involved faulty equipment. Find a point estimate for p, the population proportion of accidents that involved faulty equipment. 2) An article a Florida newspaper reported on the topics that teenagers most want to discuss with their pare nts. The findings, the results of a poll, showed that 46% would like more discussion about the family's financial situation, 37% would like to talk about school, and 30% would like to talk...
 Researchers wondered if there was a difference between males and females in regard to some common annoyances. They asked a random sample of tales and ferrales, the following question: "Are you annoyed by people who repeatedly check their mobile phones while having aan in-person coriversaliun?" Ainung the 580 males surveyed 218 resurideu "Yes", argile 520 fernales surveyed, 212 responded Yes."Dues the eviderice sugges, a higher proportion of females are annoyed by this beliaviar? Cumplete paris (a) through (g) belun. (a)...
 Probability and I A recent Gallup Poll asked a simple random sample o cigarettes in the past week?" Suppose that in fact 20 question. The proportion of the sample who answer this, we simulated 1000 samples of size n=1600 from a populatie smoked cigarettes in the past week. The results of this simula the percentage column and write your answers as decimals done for you as an example.) om sample of 1600 American adults, "Have you, yourself smoked any ose...
 Just Need part 4
You will conduct statistical surveys in which you attempt to make a conclusion about multiple population parameters. Here are the project guidelines: You will use the De Anza College student body as your population You must sample at least 50 students, asking them 2 questions Question #1: This will be an average / 1-population question Question #2: This will be a proportion / 2-population question You must work in groups of 1 to 3 people (You...
Just Need part 4
You will conduct statistical surveys in which you attempt to make a conclusion about multiple population parameters. Here are the project guidelines: You will use the De Anza College student body as your population You must sample at least 50 students, asking them 2 questions Question #1: This will be an average / 1-population question Question #2: This will be a proportion / 2-population question You must work in groups of 1 to 3 people (You...
Most questions answered within 3 hours.
-
The condensate from a steam distillation contains 12.0 g of
compound A and 18.0 g of...
asked 30 minutes ago -
A major economic benefit of fixed exchange rates compared to
floating rates is that
a. the...
asked 39 minutes ago -
1) For this reaction,
SiCl4 (l)+ 2H2O(g) <->
SiO2 (s) + 4HCl (g) DeltaH = -127 KJ...
asked 36 minutes ago -
Which of the following does NOT add to US GDP? A. Saudi Arabia
buys fighter jets...
asked 2 hours ago -
2. Describe market equilibrium in terms of the following
characteristics
d.
How supply and demand interactions...
asked 1 hour ago -
1a. Create a class named Computer
- Separate declaration from implementation (i.e. Header and CPP
files)...
asked 2 hours ago -
A medical researcher
believes that a drug changes the body's temperature. Seven test
subjects are randomly...
asked 2 hours ago -
A call option on Project Cash Flow Consulting Inc.'s stock (PCF)
has a market price of...
asked 2 hours ago -
A study on the latest fad diet claimed that the amounts of
weight lost by all...
asked 2 hours ago -
give examples of how gene expression is inherited to the next
generation?
asked 2 hours ago -
If a project has _________ IRR(s), we should __________ . Assume
this project is competing with...
asked 2 hours ago -
In the figure, a sound of wavelength 0.700 m is emitted
isotropically by point source S....
asked 3 hours ago