A student believes that the average grade on the statistics final examination was 87. A sample...
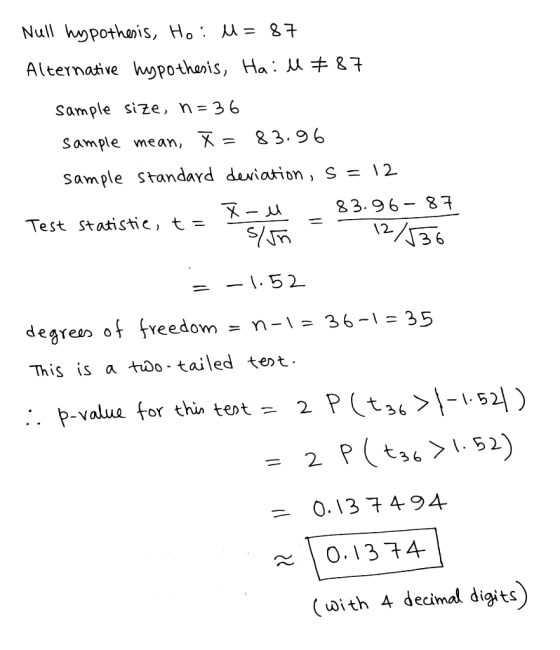
A student believes that the average grade on the statistics final examination was 87. A sample of 36 final examinations was taken. The average grade in the sample was 83.96 with a standard deviation of 12. The student wants to test whether the average is different from 87 at 90% level of confidence. Compute the p-value for this test.
NOTE: WRITE YOUR ANSWER WITH 4 DECIMAL DIGITS. DO NOT ROUND UP OR DOWN.
Homework Answers
Add Answer to:
A student believes that the average grade on the statistics
final examination was 87. A sample...
A student believes that the average grade on the statistics final examination is 87. A sample...
 A student believes that the average grade on the statistics final examination is 87. A sample of 36 final examinations is taken. The average grade in the sample is 83.96. The population variance is 144. Compute the probability of a Type Il error if the average grade on the final is 85,
A student believes that the average grade on the final examination in statistics is at least...
A student believes that the average grade on the final examination in statistics is at least 85. She plans on taking a sample to test her belief. The correct set of hypotheses is A. H 0 : μ < 85 H a : μ >= 85 B. H 0 : μ < 85 H a : μ > 85 C. H 0 : μ>= 85 H a : μ < 85 D. H 0 : μ > 85 H a :...
ofessor believes that the final examination scores in statistics distributed. A sample of 40 final s...
 ofessor believes that the final examination scores in statistics distributed. A sample of 40 final s sample of 40 final scores has been taken. You are given the sample below. The mean of the scores is 83.1, and the standar the scores is 83.1, and the standard deviation is 10.43. 56 63 65 68 72 72 73 75 77 78 78 79 80 80 80 80 80 80 81 81 82 84 84 86 86 87 88 90 90 92...
In a statistics class, the average grade on the final examination was 75 with a standard...
 In a statistics class, the average grade on the final examination was 75 with a standard deviation of 5. a. At least what percentage of the students received grades between 50 and 100? Determine an interval for the grades that will be true for at least 70% of the students. b.
A set of final examinations grades in an introductory statistics course is normally distributed, with a...
A set of final examinations grades in an introductory statistics course is normally distributed, with a mean of 75 and a standard deviation of 7. Complete parts (a) through (d). a.) What is the probability that a student scored below 87 on this exam? b.) What is the probability that a student scored between 68 and 90? c.) The probability is 25% that a student taking the test scores higher than what grade? d.) If the professor grades on a...
A random sample of 16 statistics examinations from a large population was taken. The average score...
A random sample of 16 statistics examinations from a large population was taken. The average score in the sample was 78.6 with a variance of 64. We are interested in determining whether the average grade of the population is significantly more than 75. Assume the distribution of the population of grades is normal. The standardized test statistic is 1.8 how to find a p value ? and how to the range of p on ti npire ?
A set of final examination grades in an introductory statistics course is normally distributed, with a...
A set of final examination grades in an introductory statistics course is normally distributed, with a mean of 73 and a standard deviation of 7. Complete parts (a) through (d). a. What is the probability that a student scored below 86 on this exam? (Round to four decimal places as needed.) b. What is the probability that a student scored between 66 and 93? (Round to four decimal places as needed.) c. The probability is 55% that a student taking...
3.3 Table 3.10 shows the scores in the final examination F and the scores in two preliminary exam...
 3.3 Table 3.10 shows the scores in the final examination F and the scores in two preliminary examinations P1 and P2 for 22 students in a statistics course. The data can be found in the book's Web site. (a) Fit each of the following models to the data: Model 1 F Bo BiP Model 2 F- Model 3 : F-k) + AP,+AP, + ε Table 3.10 Examination Data: Scores in the Final (F), First Preliminary (Pi), and Second Preliminary (P2)...
The final exam grade of a statistics class has a skewed distribution with mean of 76...
The final exam grade of a statistics class has a skewed distribution with mean of 76 and standard deviation of 7.4. If a random sample of 36 students selected from this class, then what is the probability that the average final exam grade of this sample is between 75 and 80? Answer: (keep 4 decimal places)
In a chemistry class, the average grade on the final examination was 60 with a standard...
 In a chemistry class, the average grade on the final examination was 60 with a standard deviation of 4. Use Chebyshev's theorem to answer the following questions. a. At least what percentage of students received grades between 54 to 66? b. At least what percentage of students received grades between 52 to 68 hours? C. Determine an interval for the grades that will be true for at least 80% of the students. (Hint: First compute the Z-score.)
 A student believes that the average grade on the statistics final examination is 87. A sample of 36 final examinations is taken. The average grade in the sample is 83.96. The population variance is 144. Compute the probability of a Type Il error if the average grade on the final is 85,
 ofessor believes that the final examination scores in statistics distributed. A sample of 40 final s sample of 40 final scores has been taken. You are given the sample below. The mean of the scores is 83.1, and the standar the scores is 83.1, and the standard deviation is 10.43. 56 63 65 68 72 72 73 75 77 78 78 79 80 80 80 80 80 80 81 81 82 84 84 86 86 87 88 90 90 92...
 In a statistics class, the average grade on the final examination was 75 with a standard deviation of 5. a. At least what percentage of the students received grades between 50 and 100? Determine an interval for the grades that will be true for at least 70% of the students. b.
 3.3 Table 3.10 shows the scores in the final examination F and the scores in two preliminary examinations P1 and P2 for 22 students in a statistics course. The data can be found in the book's Web site. (a) Fit each of the following models to the data: Model 1 F Bo BiP Model 2 F- Model 3 : F-k) + AP,+AP, + ε Table 3.10 Examination Data: Scores in the Final (F), First Preliminary (Pi), and Second Preliminary (P2)...
 In a chemistry class, the average grade on the final examination was 60 with a standard deviation of 4. Use Chebyshev's theorem to answer the following questions. a. At least what percentage of students received grades between 54 to 66? b. At least what percentage of students received grades between 52 to 68 hours? C. Determine an interval for the grades that will be true for at least 80% of the students. (Hint: First compute the Z-score.)
Most questions answered within 3 hours.
-
For a 2-Level design, with 8 factors, a recommended screening
design model is:
a. Taguchi L12...
asked 30 minutes ago -
1. Define a function in python that returns the sum of the
following 4 lists. Remember...
asked 21 minutes ago -
Elspeth, associate research specialist for a marketing research
firm in a large Midwestern city, had just...
asked 21 minutes ago -
If domestic savings are insufficient to finance domestic private
investment and exports are greater than imports,...
asked 37 minutes ago -
Q.4.
Use the format in Exhibit 9-1 to compute the ending LIFO
inventory and cost of...
asked 42 minutes ago -
Discuss the different receiving and dispatch equipment required
for uploading and loading different types of material...
asked 47 minutes ago -
Which of the following is true for simultaneous testing?
a. Net specificity is greater than the...
asked 51 minutes ago -
Discuss the importance of homologous recombination and
transposition in natural horizontal gene transfer and evolution. Be...
asked 55 minutes ago -
Brittle material has the properties Sut = 30 kpsi and Suc = 90
kpsi. Using the...
asked 54 minutes ago -
*
write about Plastic recycling statistics ( Plastic recycling rate )
last two years , i...
asked 53 minutes ago -
The activation energy for a given reaction is 50.3 kJ/mol. If
the rate constant for the...
asked 1 hour ago -
An entomologist discovers a dung beetle rolling a ball of dung
along the ground, and decides...
asked 3 hours ago