A researcher in a university's biology department studied the effect of agriculture contaminants on the stream...
A researcher in a university's biology department studied the effect of agriculture contaminants on the stream fish population in northeastern Indiana. Specially-designed traps collected samples of fish at each of four stream locations. A research question was "Did the differences in agricultural contaminants found at the four locations alter the proportion of the fish population by gender?" Suppose observed frequencies were as follows.
| gender | A | B | C | D |
| male | 53 | 48 | 53 | 43 |
| female | 37 | 42 | 32 | 40 |
A) Focusing on the proportion of male fish at each location, test the hypothesis that the population proportions are equal for all four locations. Use a 0.05 level of significance.
State the null and alternative hypotheses.
(a.) H0: Not all population
proportions are equal.
Ha: pA =
pB = pC =
pD
(b.) H0:
All population proportions are not equal.
Ha: pA =
pB = pC =
pD
(c.) H0:
pA = pB =
pC = pD
Ha: Not all population proportions are
equal.
(d.) H0:
pA = pB =
pC = pD
Ha: All population proportions are not
equal.
A-1.) Find the value of the test statistic. (Round your answer to three decimal places.) =___________________
A-2.) What is the p-value? (Round your answer to four decimal places.)
p-value =____________
A-3)What is your conclusion?
(a.) Reject H0. We cannot reject the hypothesis that the population proportions are equal in each location.
(b.) Do not reject H0. We cannot reject the hypothesis that the population proportions are equal in each location.
(c.) Do not reject H0. We conclude that the population proportions are not equal in each location.
(d.) Reject H0. We conclude that the population proportions are not equal in each location.
B) Does it appear that differences in agricultural contaminants found at the four locations altered the fish population by gender?
(a.) Yes, there is evidence that differences in agricultural contaminants found at the four locations altered the fish population by gender.
(b.) No, there is no evidence that differences in agricultural contaminants found at the four locations altered the fish population by gender.
Homework Answers
A]
State the null and alternative hypotheses.
Null hypothesis: All population proportions are equal that is
Alternative hypothesis: Not all population
proportions are equal
Option C] is correct choice
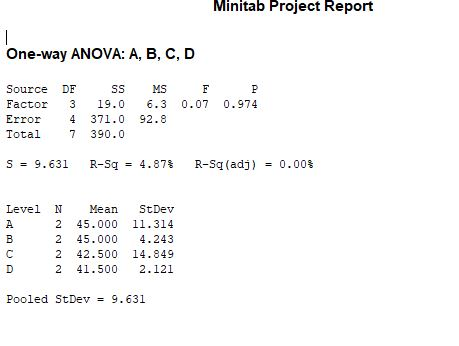
A-1]
The value of the test statistic F = 0.070
A-2]
The p-value = 0.9740
A-3]
Conclusion :
Here P-value is greater than level of significant 0.05
Do not reject H0. We cannot reject the hypothesis that the population proportions are equal in each location.
Option b] is correct choice
B) Does it appear that differences in agricultural contaminants found at the four locations altered the fish population by gender?
(b.) No, there is no evidence that differences in agricultural contaminants found at the four locations altered the fish population by gender.
Add Answer to:
A researcher in a university's biology department studied the
effect of agriculture contaminants on the stream...
Kate Sanders, a researcher in the department of biology at IPFW University, studied the effect of...
 Kate Sanders, a researcher in the department of biology at IPFW University, studied the effect of agriculture contaminants on the stream fish population in Northeastern Indiana (April 2012). Specially designed traps collected samples of fish at each of four stream locations. A research question was: did the differences In agricultural contaminants found at the four locations alter the proportion of the fish population by gender? Observed frequencies were as follows Stream Locations Gender Male Female 49 4449 39 41 46...
You may need to use the appropriate technology to answer this question A researcher in a...
 You may need to use the appropriate technology to answer this question A researcher in a university's biology department studied the effect of agriculture contaminants on the stream fish population in northeastern Indiana. Specially-designed traps collected samples of fish at each of four stream locations. A research question was "Did the differences in agricultural contaminants found at the four locations alter the proportion of the fish population by gender?" Suppose observed frequencies were as follows Stream Locations Gender ABIC D...
Kate Sanders, a researcher in the department of biology at IPFW University, studied the effect of...
 Kate Sanders, a researcher in the department of biology at IPFW
University, studied the effect of agriculture contaminants on the
stream fish population in northeastern Indiana (April 2012).
Specially designed traps collected samples of fish at each of four
stream locations. A research question was: did the differences in
agricultural contaminants found at the four locations alter the
proportion of the fish population by gender? Observed frequencies
were as follows.
Excel File: data12-21.xlsx
a. Focusing on the proportion of male...
Kate Sanders, a researcher in the department of biology at IPFW
University, studied the effect of agriculture contaminants on the
stream fish population in northeastern Indiana (April 2012).
Specially designed traps collected samples of fish at each of four
stream locations. A research question was: did the differences in
agricultural contaminants found at the four locations alter the
proportion of the fish population by gender? Observed frequencies
were as follows.
Excel File: data12-21.xlsx
a. Focusing on the proportion of male...
You tridy rieed to use Lhe appropriale technlogy to answer Lis questi researcher in a university...
 You tridy rieed to use Lhe appropriale technlogy to answer Lis questi researcher in a university s biology department studied the ettect ot g iculture contaminants on the stream tish population in northeastern Indiana. 5pedall designed traps co lected samples of tish at each of tour stream locations. ก็ research question was Did the diTerences in agricultural contaminants found at the four locatioris alter the proportion of the fish population by gender?" Suppose cbserved frequencies were as follows Stream Locations...
Use the data from Prob. 5 with a 0.05 level of significance and answer the following:...
 Use the data from Prob. 5 with a 0.05 level of significance and
answer the following:
a) Are the proportions of male fish equal across the stream
locations? Explain.
b) If there is a difference in proportions of male fish across
stream locations, do a Marascuilo pairwise comparison for each
pairing and report results, i.e., is there difference in male
proportions between streams A and B, A and C, A and D, B and C, B
and D, and C...
Use the data from Prob. 5 with a 0.05 level of significance and
answer the following:
a) Are the proportions of male fish equal across the stream
locations? Explain.
b) If there is a difference in proportions of male fish across
stream locations, do a Marascuilo pairwise comparison for each
pairing and report results, i.e., is there difference in male
proportions between streams A and B, A and C, A and D, B and C, B
and D, and C...
Test the following hypotheses by using the x goodness of fit test. HO: pA = 0.40,...
 Test the following hypotheses by using the x goodness of fit test. HO: pA = 0.40, pB = 0.40, and pc = 0.20 Ha: The population proportions are not PA 0.40, PB 0.40, and Pc-0.20 A sample of size 200 yielded 40 in category A 140 in category B, and 20 in category C. Use a 1 and test to see whether the proportions are as stated n·。 (a) Use the p-value approach. Find the value of the test statistic....
Answers to Multiple-Choice Problems: A student wants to see if the correct answers to multiple choice...
Answers to Multiple-Choice Problems: A student wants to see if the correct answers to multiple choice problems are evenly distributed. She heard a rumor that if you don't know the answer, you should always pick C. In a sample of 100 multiple-choice questions from prior tests and quizzes, the distribution of correct answers are given in the table below. In all of these questions, there were four options {A, B, C, D}. Correct Answers (n = 100) A B C...
The Fish and Game Department stocked a lake with fish in the following proportions: 30% catfish,...
The Fish and Game Department stocked a lake with fish in the following proportions: 30% catfish, 15% bass, 40% bluegill, and 15% pike. Five years later it sampled the lake to see if the distribution of fish had changed. It found that the 500 fish in the sample were distributed as follows. Catfish Bass Bluegill Pike 112 91 224 73 In the 5-year interval, did the distribution of fish change at the 0.05 level? (i) State the null and alternate...
The National Highway Traffic Safety Administration reported the percentage of traffic accidents occurring each day of...
 The National Highway Traffic Safety Administration reported the percentage of traffic accidents occurring each day of the week. Assume that a sample of 420 accidents provided the following data Sunday Monday Tues day Wednesday Thursday riday Saturday 50 53 47 69 (a) Conduct a hypothesis test to determine if the proportion of traffic accidents is the same for each day of the week. Use a 0.05 level of significance. State the null and alternative hypotheses. Ho: Not all proportions are...
After randomly assigning subjects to treatments in a randomized comparative experiment, we can compare the treatment...
 After randomly assigning subjects to treatments in a randomized comparative experiment, we can compare the treatment groups to see how well the randomization worked. We hope to find no significant differences among the groups. A study of how to provide premature infants with a substance essential to their development assigned infants at random to receive one of four types of supplement, called PBM, NLCP, PL-LCP, and TG- LCP. We are interested in whether the randomization results in equal proportions of...
 Kate Sanders, a researcher in the department of biology at IPFW University, studied the effect of agriculture contaminants on the stream fish population in Northeastern Indiana (April 2012). Specially designed traps collected samples of fish at each of four stream locations. A research question was: did the differences In agricultural contaminants found at the four locations alter the proportion of the fish population by gender? Observed frequencies were as follows Stream Locations Gender Male Female 49 4449 39 41 46...
 You may need to use the appropriate technology to answer this question A researcher in a university's biology department studied the effect of agriculture contaminants on the stream fish population in northeastern Indiana. Specially-designed traps collected samples of fish at each of four stream locations. A research question was "Did the differences in agricultural contaminants found at the four locations alter the proportion of the fish population by gender?" Suppose observed frequencies were as follows Stream Locations Gender ABIC D...
 Kate Sanders, a researcher in the department of biology at IPFW
University, studied the effect of agriculture contaminants on the
stream fish population in northeastern Indiana (April 2012).
Specially designed traps collected samples of fish at each of four
stream locations. A research question was: did the differences in
agricultural contaminants found at the four locations alter the
proportion of the fish population by gender? Observed frequencies
were as follows.
Excel File: data12-21.xlsx
a. Focusing on the proportion of male...
Kate Sanders, a researcher in the department of biology at IPFW
University, studied the effect of agriculture contaminants on the
stream fish population in northeastern Indiana (April 2012).
Specially designed traps collected samples of fish at each of four
stream locations. A research question was: did the differences in
agricultural contaminants found at the four locations alter the
proportion of the fish population by gender? Observed frequencies
were as follows.
Excel File: data12-21.xlsx
a. Focusing on the proportion of male...
 You tridy rieed to use Lhe appropriale technlogy to answer Lis questi researcher in a university s biology department studied the ettect ot g iculture contaminants on the stream tish population in northeastern Indiana. 5pedall designed traps co lected samples of tish at each of tour stream locations. ก็ research question was Did the diTerences in agricultural contaminants found at the four locatioris alter the proportion of the fish population by gender?" Suppose cbserved frequencies were as follows Stream Locations...
 Use the data from Prob. 5 with a 0.05 level of significance and
answer the following:
a) Are the proportions of male fish equal across the stream
locations? Explain.
b) If there is a difference in proportions of male fish across
stream locations, do a Marascuilo pairwise comparison for each
pairing and report results, i.e., is there difference in male
proportions between streams A and B, A and C, A and D, B and C, B
and D, and C...
Use the data from Prob. 5 with a 0.05 level of significance and
answer the following:
a) Are the proportions of male fish equal across the stream
locations? Explain.
b) If there is a difference in proportions of male fish across
stream locations, do a Marascuilo pairwise comparison for each
pairing and report results, i.e., is there difference in male
proportions between streams A and B, A and C, A and D, B and C, B
and D, and C...
 Test the following hypotheses by using the x goodness of fit test. HO: pA = 0.40, pB = 0.40, and pc = 0.20 Ha: The population proportions are not PA 0.40, PB 0.40, and Pc-0.20 A sample of size 200 yielded 40 in category A 140 in category B, and 20 in category C. Use a 1 and test to see whether the proportions are as stated n·。 (a) Use the p-value approach. Find the value of the test statistic....
 The National Highway Traffic Safety Administration reported the percentage of traffic accidents occurring each day of the week. Assume that a sample of 420 accidents provided the following data Sunday Monday Tues day Wednesday Thursday riday Saturday 50 53 47 69 (a) Conduct a hypothesis test to determine if the proportion of traffic accidents is the same for each day of the week. Use a 0.05 level of significance. State the null and alternative hypotheses. Ho: Not all proportions are...
 After randomly assigning subjects to treatments in a randomized comparative experiment, we can compare the treatment groups to see how well the randomization worked. We hope to find no significant differences among the groups. A study of how to provide premature infants with a substance essential to their development assigned infants at random to receive one of four types of supplement, called PBM, NLCP, PL-LCP, and TG- LCP. We are interested in whether the randomization results in equal proportions of...
Most questions answered within 3 hours.
-
The free energy change for the following reaction at 25 °C, when
[Sn2+] = 1.17 M...
asked 1 hour ago -
An MNE is this kind of industry when competition in one country
is essentially independent of...
asked 3 hours ago -
. For this set of questions, determine what
proportion of a normal distribution is located betweeneach...
asked 3 hours ago -
A college student is employed as a door-to-door newspaper
salesman. Historical data suggests that the student...
asked 4 hours ago -
MATLAB HW 11 problem using Switch Case and Input commands
Write a script file that calculates...
asked 4 hours ago -
Considering gravitational time dilation, calculate the time that
passes in Earth’s surface while 1 hour passes...
asked 4 hours ago -
Minitab Problem: Take the Lake Hume June rainfall data and find
use the processes outlined in...
asked 5 hours ago -
X Company is trying to decide whether to continue using old
equipment to make Product A...
asked 5 hours ago -
IN PYTHON ONLY !! Program 2: Re-work
program #5 (WeeklyHours) from the previous assignment such that...
asked 6 hours ago -
The average length of time between arrivals at a turnpike
toll-booth is 26 seconds. What is...
asked 8 hours ago -
(a) A piston at 6.1 atm contains a gas that occupies a volume of
3.5 L....
asked 9 hours ago -
Please answer true or false. Words
cannot be changed or added in to make it true...
asked 9 hours ago