
Homework Answers
a.
 b.
b.
c. Taking into consideration that it is a constant cost industry, we conclude that the Long Run Average Cost (LAC) is independent of the quantity of goods produced. The long-run equilibrium price in the industry would be the minimum of LAC, and the supply on per firm basis would be completely driven by the dynamics of demand in the long run, but in the scenario of constant cost industry, the short-run marginal cost curve (the positive part of the SMC is the supply curve of the firm.) is equal to the long-run marginal curve. Whenever there is a deviation from a long industry supply curve (horizontal line at minimum LAC), the firm's output fluctuates, but returns to minimum LAC with change firm and industry output as per change in demand.
d. In an increasing cost industry, the cost of input variables increases with an increase in production. Therefore, if like the constant cost industry, where LAC is independent of output level, in increasing cost industry, as the output increases as a result of increased demand, the cost input variable rises, and causes the LACs to rise (as new firms enter the market, and tee input variables available to each firm in the industry decreases, driving the prices up.) There is an increase in production on the firm level, but at an increased cost.
Add Answer to:
Quick question I need answered as soon as possible
3. Cost curves, profits/losses, and long-run equilibrium:...
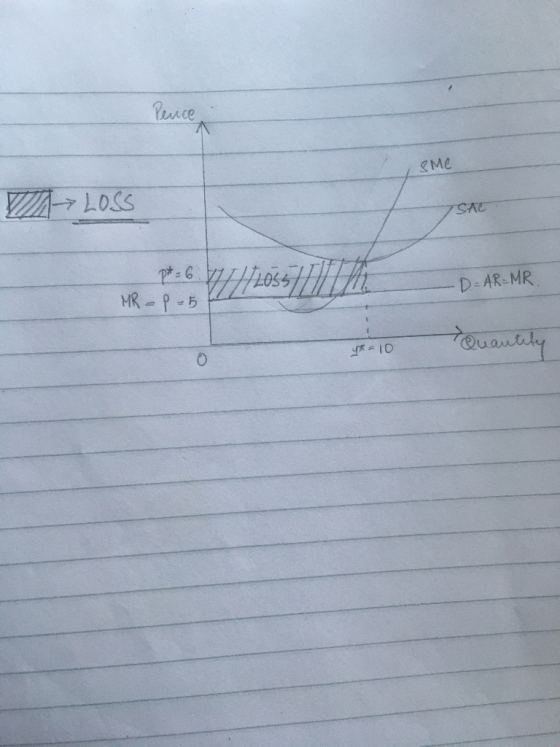
Cost curves, profits/losses, and long-run equilibrium: a. Draw typical short run average cost and marginal cost...
Cost curves, profits/losses, and long-run equilibrium: a. Draw typical short run average cost and marginal cost curves for a firm (costs on the vertical axis, q on the horizontal axis), such that marginal cost = average cost= 6 at q=10. b. Suppose this firm operates as a perfect competitor in a market with a short run equilibrium price of $5. Illustrate on your graph the area indicating the short run profit or loss experienced by this firm, given the cost...
Need help as soon as possible 1. Short Run Cost Curves: Consider two firms, producing different...
 Need help as soon as possible
1. Short Run Cost Curves: Consider two firms, producing different products, with the following production functions: q=5KL (1) q=5(KL)-S (2) a. For a short-run situation in which K=100, and given wage = 3 and cost of capital = 1, derive expressions short run total cost for each production function. (Start by using the production function to develop an expression for Lin terms of q, and then substitute that, and the given parameters, into the...
Need help as soon as possible
1. Short Run Cost Curves: Consider two firms, producing different products, with the following production functions: q=5KL (1) q=5(KL)-S (2) a. For a short-run situation in which K=100, and given wage = 3 and cost of capital = 1, derive expressions short run total cost for each production function. (Start by using the production function to develop an expression for Lin terms of q, and then substitute that, and the given parameters, into the...
A monopolistic competitor in long-run equilibrium is like a perfect competitor in that A. zero economic...
A monopolistic competitor in long-run equilibrium is like a perfect competitor in that A. zero economic profits are made. B. price equals marginal cost. C. both produce at the minimum points of their average total cost curves. D. price is greater than marginal cost.
5. Short-run supply and long-run equilibrium Consider the competitive market for titanium. Assume that, regardless of...
 5. Short-run supply and long-run
equilibrium
Consider the competitive market for titanium. Assume that,
regardless of how many firms are in the industry, every firm in the
industry is identical and faces the marginal cost (MC), average
total cost (ATC), and average variable cost (AVC) curves shown on
the following graph.
Consider the competitive market for titanium. Assume that, regardless of how many firms are in the industry, every firm in the industry is identical and faces the marginal cost...
5. Short-run supply and long-run
equilibrium
Consider the competitive market for titanium. Assume that,
regardless of how many firms are in the industry, every firm in the
industry is identical and faces the marginal cost (MC), average
total cost (ATC), and average variable cost (AVC) curves shown on
the following graph.
Consider the competitive market for titanium. Assume that, regardless of how many firms are in the industry, every firm in the industry is identical and faces the marginal cost...
7. Short-run supply and long-run equilibrium Consider the competitive market for copper. Assume...
 7. Short-run supply and long-run equilibrium Consider the competitive market for copper. Assume that, regardless of how many firms are in the industry, every firm in the industry is identical and faces the marginal cost (MC), average total cost (ATC), and average variable cost (AVC) curves shown on the following graph.
7. Short-run supply and long-run equilibrium Consider the competitive market for copper. Assume that, regardless of...
 7. Short-run supply and long-run equilibrium Consider the competitive market for copper. Assume that, regardless of how many firms are in the industry, every firm in the industry is identical and faces the marginal cost (MC), average total cost (ATC), and average variable cost (AVC) curves shown on the following graph
For a constant cost industry in which all firms the same cost functions, their long-run average...
For a constant cost industry in which all firms the same cost functions, their long-run average cost is minimized at $10 per unit output and 20 units (i.e. q = 20). Market demand is given by QD=DP=1,500-50P. Find the long-run market supply function Find the long-run equilibrium price (P*), market quantity (Q*), firm output (q*), number of firms (n), and each firm’s profit. The short-run total cost function associated with each firm’s long-run costs is SCq=0.5q2-10q+200. Calculate the short-run average...
a. Draw a pair of diagram illustrating both Short-run and Long Run equilibrium of Chamberlinian monopolistic...
a. Draw a pair of diagram illustrating both Short-run and Long Run equilibrium of Chamberlinian monopolistic competition. The diagrams contain average cost, average variable cost, marginal cost, and marginal revenue curves and shade area that represents abnormal profit. Make your diagrams large and label all curves, axes, and points b. In the price-leadership-by-a-dominant-firm model: a. After the dominant firm sets the market price, what is the output-supply behavior of the remaining firms in the industry?
a. Draw a pair of diagram illustrating both Short-run and Long Run equilibrium of Chamberlinian monopolistic...
a. Draw a pair of diagram illustrating both Short-run and Long Run equilibrium of Chamberlinian monopolistic competition. The diagrams contain average cost, average variable cost, marginal cost, and marginal revenue curves and shade area that represents abnormal profit. Make your diagrams large and label all curves, axes, and points. b. In the price-leadership-by-a-dominant-firm model: a. After the dominant firm sets the market price, what is the output-supply behavior of the remaining firms in the industry?
please complete the LR line 3. Moving from short-run to long-run equilibrium Suppose the competitive market...
 please complete the LR line
3. Moving from short-run to long-run equilibrium Suppose the competitive market for cat toys is in short-run equilibrium. The following graph on the left shows the demand and short-run supply for cat toys. Assume every firm in this industry is identical. The graph on the right shows the marginal cost (MC) and average cost (AC) curves for each firm in the long run. Short-Run Market Individual Firm Supply PRICE (Dollars per cat toy) AAAAAAAA+ COST...
please complete the LR line
3. Moving from short-run to long-run equilibrium Suppose the competitive market for cat toys is in short-run equilibrium. The following graph on the left shows the demand and short-run supply for cat toys. Assume every firm in this industry is identical. The graph on the right shows the marginal cost (MC) and average cost (AC) curves for each firm in the long run. Short-Run Market Individual Firm Supply PRICE (Dollars per cat toy) AAAAAAAA+ COST...
 Need help as soon as possible
1. Short Run Cost Curves: Consider two firms, producing different products, with the following production functions: q=5KL (1) q=5(KL)-S (2) a. For a short-run situation in which K=100, and given wage = 3 and cost of capital = 1, derive expressions short run total cost for each production function. (Start by using the production function to develop an expression for Lin terms of q, and then substitute that, and the given parameters, into the...
Need help as soon as possible
1. Short Run Cost Curves: Consider two firms, producing different products, with the following production functions: q=5KL (1) q=5(KL)-S (2) a. For a short-run situation in which K=100, and given wage = 3 and cost of capital = 1, derive expressions short run total cost for each production function. (Start by using the production function to develop an expression for Lin terms of q, and then substitute that, and the given parameters, into the...
 5. Short-run supply and long-run
equilibrium
Consider the competitive market for titanium. Assume that,
regardless of how many firms are in the industry, every firm in the
industry is identical and faces the marginal cost (MC), average
total cost (ATC), and average variable cost (AVC) curves shown on
the following graph.
Consider the competitive market for titanium. Assume that, regardless of how many firms are in the industry, every firm in the industry is identical and faces the marginal cost...
5. Short-run supply and long-run
equilibrium
Consider the competitive market for titanium. Assume that,
regardless of how many firms are in the industry, every firm in the
industry is identical and faces the marginal cost (MC), average
total cost (ATC), and average variable cost (AVC) curves shown on
the following graph.
Consider the competitive market for titanium. Assume that, regardless of how many firms are in the industry, every firm in the industry is identical and faces the marginal cost...
 7. Short-run supply and long-run equilibrium Consider the competitive market for copper. Assume that, regardless of how many firms are in the industry, every firm in the industry is identical and faces the marginal cost (MC), average total cost (ATC), and average variable cost (AVC) curves shown on the following graph
 please complete the LR line
3. Moving from short-run to long-run equilibrium Suppose the competitive market for cat toys is in short-run equilibrium. The following graph on the left shows the demand and short-run supply for cat toys. Assume every firm in this industry is identical. The graph on the right shows the marginal cost (MC) and average cost (AC) curves for each firm in the long run. Short-Run Market Individual Firm Supply PRICE (Dollars per cat toy) AAAAAAAA+ COST...
please complete the LR line
3. Moving from short-run to long-run equilibrium Suppose the competitive market for cat toys is in short-run equilibrium. The following graph on the left shows the demand and short-run supply for cat toys. Assume every firm in this industry is identical. The graph on the right shows the marginal cost (MC) and average cost (AC) curves for each firm in the long run. Short-Run Market Individual Firm Supply PRICE (Dollars per cat toy) AAAAAAAA+ COST...
Most questions answered within 3 hours.
-
An MNE is this kind of industry when competition in one country
is essentially independent of...
asked 32 minutes ago -
. For this set of questions, determine what
proportion of a normal distribution is located betweeneach...
asked 1 hour ago -
A college student is employed as a door-to-door newspaper
salesman. Historical data suggests that the student...
asked 2 hours ago -
MATLAB HW 11 problem using Switch Case and Input commands
Write a script file that calculates...
asked 1 hour ago -
Considering gravitational time dilation, calculate the time that
passes in Earth’s surface while 1 hour passes...
asked 2 hours ago -
Minitab Problem: Take the Lake Hume June rainfall data and find
use the processes outlined in...
asked 3 hours ago -
X Company is trying to decide whether to continue using old
equipment to make Product A...
asked 3 hours ago -
IN PYTHON ONLY !! Program 2: Re-work
program #5 (WeeklyHours) from the previous assignment such that...
asked 3 hours ago -
The average length of time between arrivals at a turnpike
toll-booth is 26 seconds. What is...
asked 5 hours ago -
(a) A piston at 6.1 atm contains a gas that occupies a volume of
3.5 L....
asked 6 hours ago -
Please answer true or false. Words
cannot be changed or added in to make it true...
asked 6 hours ago -
An empty test tube weighs 15.923 grams. Then,
MgCl2•6H2O is added into the test tube. After...
asked 6 hours ago