a. Draw a pair of diagram illustrating both Short-run and Long Run equilibrium of Chamberlinian monopolistic...
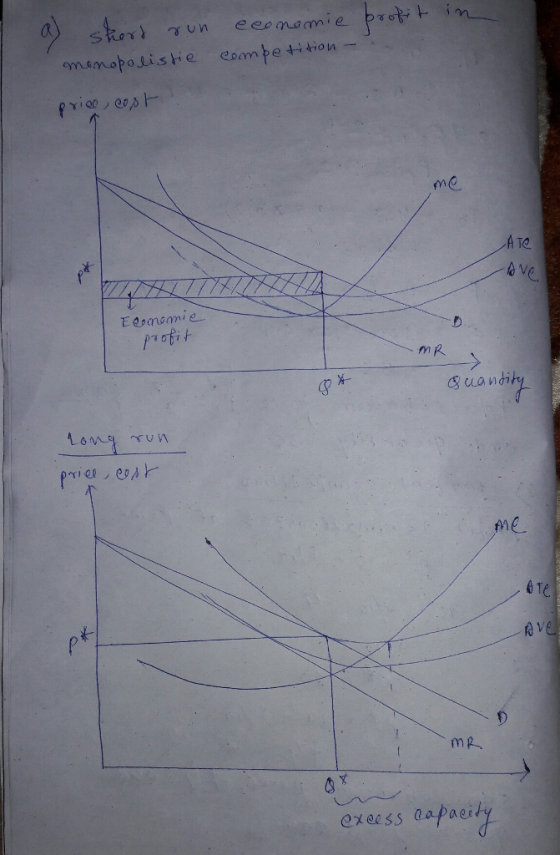
a. Draw a pair of diagram illustrating both Short-run and Long Run equilibrium of Chamberlinian monopolistic competition. The diagrams contain average cost, average variable cost, marginal cost, and marginal revenue curves and shade area that represents abnormal profit. Make your diagrams large and label all curves, axes, and points.
b. In the price-leadership-by-a-dominant-firm model: a. After the dominant firm sets the market price, what is the output-supply behavior of the remaining firms in the industry?
Homework Answers
a) Short run profit=(price-ATC)*quantity. In the short run, a monopolistically competitive firm produces quantity at MR=MC. If the average total cost is below the market price then the firm will earn an economic profit.
In the long run, more firms enter because of this profit which reduces the profit of other firms. Firms will enter until the firms earn only a normal profit. Firms earn a normal profit when P=ATC. That is the demand curve tangent with the average total cost.
Excess capacity is (the quantity produced at minimum ATC-quantity that earns the greatest profit at MR=MC). Monopolistically competitive firms do not operate at their minimum ATC so operate with excess capacity.
Add Answer to:
a. Draw a pair of diagram illustrating both Short-run and Long
Run equilibrium of Chamberlinian monopolistic...
a. Draw a pair of diagram illustrating both Short-run and Long Run equilibrium of Chamberlinian monopolistic...
a. Draw a pair of diagram illustrating both Short-run and Long Run equilibrium of Chamberlinian monopolistic competition. The diagrams contain average cost, average variable cost, marginal cost, and marginal revenue curves and shade area that represents abnormal profit. Make your diagrams large and label all curves, axes, and points b. In the price-leadership-by-a-dominant-firm model: a. After the dominant firm sets the market price, what is the output-supply behavior of the remaining firms in the industry?
a. Draw a pair of diagram illustrating both Short-run and Long Run equilibrium of Chamberlinian monopolistic...
 a. Draw a pair of diagram illustrating both Short-run and Long Run equilibrium of Chamberlinian monopolistic competition. The diagrams contain average cost, average variable cost, marginal cost, and marginal revenue curves and shade area that represents abnormal profit. Make your diagrams large and label all curves, axes, and points (10 points). b. In the price-leadership-by-a-dominant-firm model: a. After the dominant firm sets the market price, what is the output-supply behavior of the remaining firms in the industry? (10 points)
a. Draw a diagram illustrating the profit maximizing output for the monopolist with abnormal profit. The...
a. Draw a diagram illustrating the profit maximizing output for the monopolist with abnormal profit. The diagram should contain short-run average cost, average variable cost, short-run marginal cost, and marginal revenue curves and shade area that represents abnormal profit. Make your diagram large and label all curves, axes, and points. b. Why, in the case of a monopolist, is marginal revenue at any output less than output price? c. Why doesn't the abnormal profit of a monopolist, unlike that of...
a. Draw a diagram illustrating the profit maximizing output for the monopolist with abnormal profit. The...
 a. Draw a diagram illustrating the profit maximizing output for the monopolist with abnormal profit. The diagram s hould contain short-run average cost, average variable cost, short-run marginal cost, and marginal rves and shade area that represents abnormal profit. Make your diagram large and label all curves, axes, and points. (10 points) b. Why, in the case of a monopolist, is marginal revenue at any output less than output price? (10 points) c. Why doesn't the abnormal profit of a...
Cost curves, profits/losses, and long-run equilibrium: a. Draw typical short run average cost and marginal cost...
Cost curves, profits/losses, and long-run equilibrium: a. Draw typical short run average cost and marginal cost curves for a firm (costs on the vertical axis, q on the horizontal axis), such that marginal cost = average cost= 6 at q=10. b. Suppose this firm operates as a perfect competitor in a market with a short run equilibrium price of $5. Illustrate on your graph the area indicating the short run profit or loss experienced by this firm, given the cost...
5. Short-run supply and long-run equilibrium Consider the competitive market for titanium. Assume that, regardless of...
 5. Short-run supply and long-run
equilibrium
Consider the competitive market for titanium. Assume that,
regardless of how many firms are in the industry, every firm in the
industry is identical and faces the marginal cost (MC), average
total cost (ATC), and average variable cost (AVC) curves shown on
the following graph.
Consider the competitive market for titanium. Assume that, regardless of how many firms are in the industry, every firm in the industry is identical and faces the marginal cost...
5. Short-run supply and long-run
equilibrium
Consider the competitive market for titanium. Assume that,
regardless of how many firms are in the industry, every firm in the
industry is identical and faces the marginal cost (MC), average
total cost (ATC), and average variable cost (AVC) curves shown on
the following graph.
Consider the competitive market for titanium. Assume that, regardless of how many firms are in the industry, every firm in the industry is identical and faces the marginal cost...
7. Short-run supply and long-run equilibrium Consider the competitive market for copper. Assume...
 7. Short-run supply and long-run equilibrium Consider the competitive market for copper. Assume that, regardless of how many firms are in the industry, every firm in the industry is identical and faces the marginal cost (MC), average total cost (ATC), and average variable cost (AVC) curves shown on the following graph.
7. Short-run supply and long-run equilibrium Consider the competitive market for copper. Assume that, regardless of...
 7. Short-run supply and long-run equilibrium Consider the competitive market for copper. Assume that, regardless of how many firms are in the industry, every firm in the industry is identical and faces the marginal cost (MC), average total cost (ATC), and average variable cost (AVC) curves shown on the following graph
7. Short-run supply and long-run equilibrium
 Screen Shot 2020-12-03 at 8.43.58 PM.pngScreen Shot 2020-12-03 at 8.44.19 PM.pngScreen Shot 2020-12-03 at 8.44.10 PM.pngConsider the competitive market for steel. Assume that, regardless of how many firms are in the industry, every firm in the industry is identical and faces the marginal cost (MC), average total cost (ATC), and average variable cost (AVC) curves shown on the following graph. 051015202530354045501009080706050403020100COSTS (Dollars per ton)QUANTITY (Thousands of tons)MCATCAVCThe following diagram shows the market demand for steel.Use the orange points (square symbol) to...
 a. Draw a pair of diagram illustrating both Short-run and Long Run equilibrium of Chamberlinian monopolistic competition. The diagrams contain average cost, average variable cost, marginal cost, and marginal revenue curves and shade area that represents abnormal profit. Make your diagrams large and label all curves, axes, and points (10 points). b. In the price-leadership-by-a-dominant-firm model: a. After the dominant firm sets the market price, what is the output-supply behavior of the remaining firms in the industry? (10 points)
 a. Draw a diagram illustrating the profit maximizing output for the monopolist with abnormal profit. The diagram s hould contain short-run average cost, average variable cost, short-run marginal cost, and marginal rves and shade area that represents abnormal profit. Make your diagram large and label all curves, axes, and points. (10 points) b. Why, in the case of a monopolist, is marginal revenue at any output less than output price? (10 points) c. Why doesn't the abnormal profit of a...
 5. Short-run supply and long-run
equilibrium
Consider the competitive market for titanium. Assume that,
regardless of how many firms are in the industry, every firm in the
industry is identical and faces the marginal cost (MC), average
total cost (ATC), and average variable cost (AVC) curves shown on
the following graph.
Consider the competitive market for titanium. Assume that, regardless of how many firms are in the industry, every firm in the industry is identical and faces the marginal cost...
5. Short-run supply and long-run
equilibrium
Consider the competitive market for titanium. Assume that,
regardless of how many firms are in the industry, every firm in the
industry is identical and faces the marginal cost (MC), average
total cost (ATC), and average variable cost (AVC) curves shown on
the following graph.
Consider the competitive market for titanium. Assume that, regardless of how many firms are in the industry, every firm in the industry is identical and faces the marginal cost...
 7. Short-run supply and long-run equilibrium Consider the competitive market for copper. Assume that, regardless of how many firms are in the industry, every firm in the industry is identical and faces the marginal cost (MC), average total cost (ATC), and average variable cost (AVC) curves shown on the following graph
Most questions answered within 3 hours.
-
What mechanisms Drive speciation??
(I.e. what was Dawins theory on the orgin of species, and how...
asked 50 minutes ago -
The manager at a car assembly plant believes that the mean
assembly time for a car...
asked 1 hour ago -
Which of the following is true of electron capture?
A) It decreases the nuclide's mass number...
asked 3 hours ago -
Assuming an efficiency of 43.10%, calculate the actual yield of
magnesium nitrate formed from 114.9 g...
asked 3 hours ago -
The highly pathogenic bacterium Clostridium
perfringens causes gangrene, a disease that results in the
destruction of...
asked 5 hours ago -
In the context of situation analysis, which of the following is
a category for analysis in...
asked 5 hours ago -
In a study of the gas phase decomposition of sulfuryl chloride
at 600 K SO2Cl2(g)SO2(g) +...
asked 5 hours ago -
75 g of 2-propanol (C3H8O) and 25 g of pentane are mixed in a
200 mL...
asked 5 hours ago -
The 2800-turn coil in a dc motor has an area per turn of 1.1 ×
10-2...
asked 5 hours ago -
Draw a combinational logic circuit diagram with a symbol inside
the box for two I/P of...
asked 5 hours ago -
The cliché we use quite a lot in finance is: there is a need to
maximize...
asked 6 hours ago -
In class we discussed the addition of HCl to alpha pinene. Would
you expect one or...
asked 6 hours ago