
Homework Answers

Add Answer to:
Figure#1: Domestic Supply Price $13 8 $1.00 Terit 6 World Price 5 2 Domestic Demand 30...
1. Suppose that we know the following demand and supply equations of a good as: po=10+20°...
 1. Suppose that we know the following demand and supply equations of a good as: po=10+20° pº = 40- 1A (Spoints) Draw the graph of the above demand and supply (must clearly label and appropriately scale the axes for full marks). 1B (5points) Find the equilibrium quantity and price, algebraically (must clearly show your work all appropriate steps for full marks)? IC (4 points) At the equilibrium price found in part B, find the consumer and producer surpluses (must clearly...
Figure 9-15 Price per Saddle Domeslic Supply 2 Tariff World Price Domestic Demand Qi 02 Q3...
 Figure 9-15 Price per Saddle Domeslic Supply 2 Tariff World Price Domestic Demand Qi 02 Q3 Q Quantity of Saddles Refer to Figure 9-15. With trade and without a tariff, the price and domestic quantity demanded are Pi and Q1- Pi and Q4 P2 and Q2- P2 and Q3.
Domestic supply wanava World price + tariff World price Domestic demand 1 2 3 4 5...
 Domestic supply wanava World price + tariff World price Domestic demand 1 2 3 4 5 6 7 8 9 10 11 12 13 14 15 16 17 18 Q Refer to Figure 9-16. The area C+D+E+F represents the decrease in consumer surplus caused by the tariff the decrease in total surplus caused by the tariff the deadweight loss of the tariff minus government revenue raised by the tariff the deadweight loss of the tariff plus government revenue raised by...
27 2$ Refer to the diagram below. Price $13 Domestic Supply 00 $1.00 Tarih ) un...
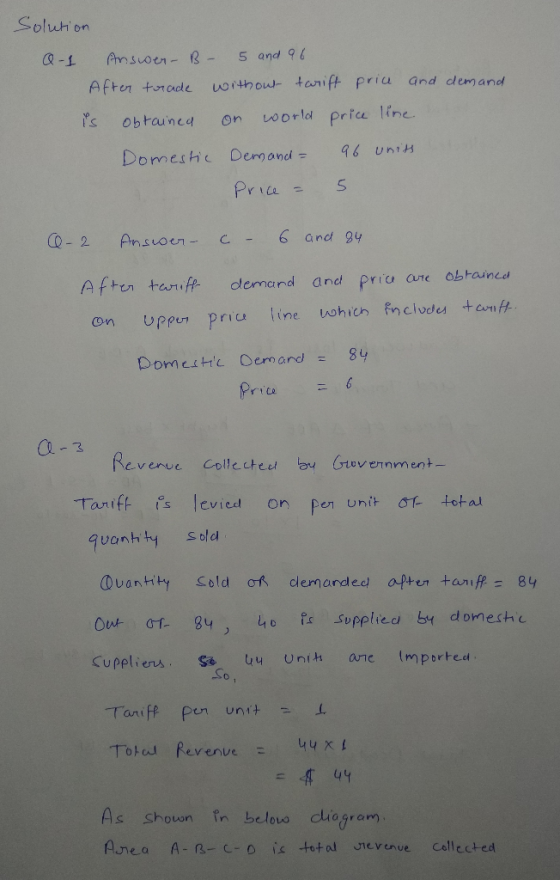
 27 2$ Refer to the diagram below. Price $13 Domestic Supply 00 $1.00 Tarih ) un World Price Domestic Demand 30 40 60 84 96 Quantity Assuming that an import quota is given to foreign producers for free. What would be the total revenue received by foreign producers if an import quota is imposed instead of a $1 per unit tariff? 00 $1.00 Tariff 10 World Price Domestic Demand 30 40 60 84 96 Quantity Assuming that an import quota...
Figure 9-12 Price Domestic Supply World Price Domestic Demand 200 400 600 800 1000 1200 1400...
 Figure 9-12 Price Domestic Supply World Price Domestic Demand 200 400 600 800 1000 1200 1400 Quantity 62. Refer to Figure 9-12. With trade allowed, this country a. exports 200 units of the good. c. imports 200 units of the good. b. exports 400 units of the good. d. exports 800 units of the good. 63. Refer to Figure 9-12. With trade, the domestic price and domestic quantity demanded are a. $18 and 400. c. $14 and 400. b. $18...
21) Refer to Figure 9-17. Without trade, consumer surplus is 1 point Figure 9-17 1 Price...
 21) Refer to Figure 9-17. Without trade, consumer surplus is 1 point Figure 9-17 1 Price Domestic Supply World price + tariff World Price Domestic Demand 4 8 12 16 20 24 28 32 36 40 44 48 52 56 60 64 68 72 76 80 84 88 92 96 100 Quantity O a. $400 and producer surplus is $200. b. $400 and producer surplus is $800. O c. $1,600 and producer surplus is $200. O d. $1,600 and producer...
Figure 9-22 The following diagram shows the domestic demand and domestic supply in a market. In...
 Figure 9-22 The following diagram shows the domestic demand and domestic supply in a market. In addition, assume that the world price in this market is $40 per unit. 1 Price Domestic Supply - -- 90 80+ 70+ 60+ Domestic Demand 200 400 600 800 1000 1200 1400 1600 1800 2000 2200 2400 Quantity 26. Refer to Figure 9-22. Suppose the government imposes a tariff of $20 per unit. With trade and a tariff, total surplus a. $96,000. b. $114,000....
The following table is domestic supply and demand schedules for a product. Suppose that the world...
 The following table is domestic supply and demand schedules for a product. Suppose that the world price of the product is $1. Quantity demanded (domestic) Quantity supplied (domestic) Price $3 10 17 Refer to the above data. The total amount of revenue collected from a $1 per unit tariff on this product will be: (Type in only numbers. NO dollar sign.) Your Answer:
+ Domestic Supply + + + + + + + + World price+tanir + - World...
 + Domestic Supply + + + + + + + + World price+tanir + - World Price -Dorst Demi + + + 6 8 12 16 20 24 2 1 36 40 # 53 56 60 64 7 # 4 M 2 100 Danny Refer to Figure 9-17. When comparing no trade to free trade, the gains from trade amount to
The following figure shows the domestic demand and supply curves for a good. With free trade,...
 The following figure shows the domestic demand and supply curves for a good. With free trade, the price of the good in the domestic market is P 3. The government introduces a 5% tariff in the market which raises the domestic price to P 2. Figure 7-1 Price Supply Demand A B C D E Quantity Refer to Figure 7-1. The increase in the government's revenue due to the imposition of a tariff is equal to: the area of GFHML....
 1. Suppose that we know the following demand and supply equations of a good as: po=10+20° pº = 40- 1A (Spoints) Draw the graph of the above demand and supply (must clearly label and appropriately scale the axes for full marks). 1B (5points) Find the equilibrium quantity and price, algebraically (must clearly show your work all appropriate steps for full marks)? IC (4 points) At the equilibrium price found in part B, find the consumer and producer surpluses (must clearly...
 Figure 9-15 Price per Saddle Domeslic Supply 2 Tariff World Price Domestic Demand Qi 02 Q3 Q Quantity of Saddles Refer to Figure 9-15. With trade and without a tariff, the price and domestic quantity demanded are Pi and Q1- Pi and Q4 P2 and Q2- P2 and Q3.
 Domestic supply wanava World price + tariff World price Domestic demand 1 2 3 4 5 6 7 8 9 10 11 12 13 14 15 16 17 18 Q Refer to Figure 9-16. The area C+D+E+F represents the decrease in consumer surplus caused by the tariff the decrease in total surplus caused by the tariff the deadweight loss of the tariff minus government revenue raised by the tariff the deadweight loss of the tariff plus government revenue raised by...
 27 2$ Refer to the diagram below. Price $13 Domestic Supply 00 $1.00 Tarih ) un World Price Domestic Demand 30 40 60 84 96 Quantity Assuming that an import quota is given to foreign producers for free. What would be the total revenue received by foreign producers if an import quota is imposed instead of a $1 per unit tariff? 00 $1.00 Tariff 10 World Price Domestic Demand 30 40 60 84 96 Quantity Assuming that an import quota...
 Figure 9-12 Price Domestic Supply World Price Domestic Demand 200 400 600 800 1000 1200 1400 Quantity 62. Refer to Figure 9-12. With trade allowed, this country a. exports 200 units of the good. c. imports 200 units of the good. b. exports 400 units of the good. d. exports 800 units of the good. 63. Refer to Figure 9-12. With trade, the domestic price and domestic quantity demanded are a. $18 and 400. c. $14 and 400. b. $18...
 21) Refer to Figure 9-17. Without trade, consumer surplus is 1 point Figure 9-17 1 Price Domestic Supply World price + tariff World Price Domestic Demand 4 8 12 16 20 24 28 32 36 40 44 48 52 56 60 64 68 72 76 80 84 88 92 96 100 Quantity O a. $400 and producer surplus is $200. b. $400 and producer surplus is $800. O c. $1,600 and producer surplus is $200. O d. $1,600 and producer...
 Figure 9-22 The following diagram shows the domestic demand and domestic supply in a market. In addition, assume that the world price in this market is $40 per unit. 1 Price Domestic Supply - -- 90 80+ 70+ 60+ Domestic Demand 200 400 600 800 1000 1200 1400 1600 1800 2000 2200 2400 Quantity 26. Refer to Figure 9-22. Suppose the government imposes a tariff of $20 per unit. With trade and a tariff, total surplus a. $96,000. b. $114,000....
 The following table is domestic supply and demand schedules for a product. Suppose that the world price of the product is $1. Quantity demanded (domestic) Quantity supplied (domestic) Price $3 10 17 Refer to the above data. The total amount of revenue collected from a $1 per unit tariff on this product will be: (Type in only numbers. NO dollar sign.) Your Answer:
 + Domestic Supply + + + + + + + + World price+tanir + - World Price -Dorst Demi + + + 6 8 12 16 20 24 2 1 36 40 # 53 56 60 64 7 # 4 M 2 100 Danny Refer to Figure 9-17. When comparing no trade to free trade, the gains from trade amount to
 The following figure shows the domestic demand and supply curves for a good. With free trade, the price of the good in the domestic market is P 3. The government introduces a 5% tariff in the market which raises the domestic price to P 2. Figure 7-1 Price Supply Demand A B C D E Quantity Refer to Figure 7-1. The increase in the government's revenue due to the imposition of a tariff is equal to: the area of GFHML....
Most questions answered within 3 hours.
-
1. Are all good samples random?
2. Magazines often report surveys giving statistics such as “63%...
asked 44 seconds ago -
Buying your in-laws a gift because it’s expected is
due to the ____________ motive of gift-giving....
asked 8 minutes ago -
Discuss the pros and cons of collaborative software such
as SameTime. Does it increase productivity? What...
asked 5 minutes ago -
A large cable company reports the following.
80% of its customers subscribe to its cable TV...
asked 7 minutes ago -
Calculate the expected value, the variance, and the standard
deviation of the given random variable X....
asked 51 minutes ago -
A hospital performs 100 surgeries per week. The probability that
complications after surgery occur is 10%....
asked 1 hour ago -
1 point) Given the significance level α=0.01 find the following:
(a) left-tailed z value z= (b)...
asked 50 minutes ago -
Assuming you are the head of the software development unit at
Cyber.Soft, explain and justify why...
asked 16 minutes ago -
Magnesium and nitrogen react in a combination reaction to
produce magnesium nitride. 3 Mg + N2...
asked 24 minutes ago -
Two electrons are initially at rest separated by a distance of
2nm. At time t=0, they...
asked 22 minutes ago -
A martial artist is practicing breaking 5 boards. He is able to
break aboard with probability...
asked 29 minutes ago -
The rate constant of a first-order reaction is 2.95 × 10⁻⁴ s−1
at 350.° C. If...
asked 32 minutes ago