Please answer all parts. No need to explain your answer.


Homework Answers
1)
stemplaot IV
2)
Thus, there are two low outliers, but the stem plot looks reasonably Normal.
3) Mean =Σx/n = 105.84
4) Std. Deviation = √(Σ(x-mean)²/(n-1)) = 14.27
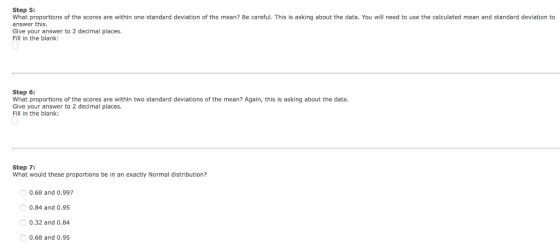
5) within 1 std dev range = (mean-std dev , mean+stdev) = (91.57,120.11)
total number within this range = 23
so, proportion = 23/31 = 0.74
6) within 2 std dev range = (mean-2std dev , mean+2stdev) = (77.2959,134.3815)
total number within this range = 29
so, proportion = 29/31 = 0.94
7) in normal distribution, proportion for within 1 std dev is 0.68 and for 2 std dev is 0.95
so, answer is 0.68 and 0.95
Add Answer to:
Please answer all parts. No need to explain your answer.
18. (3.46) Here are the IQ...
(3.46) Here are the IQ test scores of 31 seventh-grade girls in a Midwest school district:...
 (3.46) Here are the IQ test scores of 31 seventh-grade girls in a Midwest school district: 14 100 104 89 102 91 114 114 103 105 108 130 120 132 1 128 18 119 8672 1 103 74 112 107 103 9896 112 112 93 Data Set eBook Step 1 We expect IQ scores to be approximately Normal Make a stemplot to check that there are no major departures from Normality. Use stems with units of tenths. Match your results...
Final Project For this assignment, use data from W1 Assignment. Using Minitab. Give instructions on how...
Final Project For this assignment, use data from W1 Assignment. Using Minitab. Give instructions on how to insert data into Minitab. This week, you will explore the hypothesis that higher levels of stress are associated with lower levels of confidence. Compute the correlation between the stress score and confidence scores. StressScore Confidence 3 100 5 112 2 125 9 150 7 136 4 107 3 143 1 141 4 134 2 148 5 139 3 117 7 76 8 99...
Sibling IQ Scores: There have been numerous studies involving the correlation and differences in IQ's among...
Sibling IQ Scores: There have been numerous studies involving the correlation and differences in IQ's among siblings. Here we consider a small example of such a study. We will test the claim that, on average, older siblings have a higher IQ than their younger sibling. The results are depicted for a sample of 10siblings in the table below. Test the claim at the 0.01 significance level. You may assume the sample of differences comes from a normally distributed population. Pair...
Sibling IQ Scores (Raw Data, Software Required): There have been numerous studies involving the correlation and...
Sibling IQ Scores (Raw Data, Software Required): There have been numerous studies involving the correlation and differences in IQ's among siblings. Here we consider a small example of such a study. We will test the claim that, on average, older siblings have a higher IQ than their younger sibling. The results are depicted for a sample of 10 siblings in the table below. Test the claim at the 0.05 significance level. You may assume the sample of differences comes from...
The data from data95.dat contains information on 78 seventh-grade students. We want to know how well each of IQ score and self-concept score predicts GPA using least-squares regression. We also want t...
The data from data95.dat contains information on 78 seventh-grade students. We want to know how well each of IQ score and self-concept score predicts GPA using least-squares regression. We also want to know which of these explanatory variables predicts GPA better. Give numerical measures that answer these questions. (Round your answers to three decimal places.) (Regressor: IQ) R 2 : (Regressor: Self-Concept) R 2 : Which variable is the better predictor? IQSelf Concept obs gpa iq gender concept 1 7.94...
please do all parts and be neat. i will give good rating! It is estimated that...
 please do all parts and be neat. i will give good
rating!
It is estimated that the average test score for a statistics exam will be u = 70, with a variance of o2 = 12. In a random sample of 8 students, the test scores are 65, 73, 74, 68, 70, 74, 69, 71, giving us the sample statistics i = 70.5 and s? = 10. Assume a normal distribution of scores. Answer the following questions to determine if...
please do all parts and be neat. i will give good
rating!
It is estimated that the average test score for a statistics exam will be u = 70, with a variance of o2 = 12. In a random sample of 8 students, the test scores are 65, 73, 74, 68, 70, 74, 69, 71, giving us the sample statistics i = 70.5 and s? = 10. Assume a normal distribution of scores. Answer the following questions to determine if...
Sibling IQ Scores: There have been numerous studies involving the correlation and differences in IQ's among...
Sibling IQ Scores: There have been numerous studies involving the correlation and differences in IQ's among siblings. Here we consider a small example of such a study. We will test the claim that, on average, older siblings have a higher IQ than their younger sibling. The results are depicted for a sample of 10 siblings in the table below. Test the claim at the 0.01 significance level. You may assume the sample of differences comes from a normally distributed population....
Sibling IQ Scores: There have been numerous studies involving the correlation and differences in IQ's among...
Sibling IQ Scores: There have been numerous studies involving the correlation and differences in IQ's among siblings. Here we consider a small example of such a study. We will test the claim that, on average, older siblings have a higher IQ than their younger sibling. The results are depicted for a sample of 10 siblings in the table below. Test the claim at the 0.05 significance level. You may assume the sample of differences comes from a normally distributed population....
The data from data349.dat contains information on 78 seventh-grade students. We want to know how well each of IQ score a...
The data from data349.dat contains information on 78 seventh-grade students. We want to know how well each of IQ score and self-concept score predicts GPA using least-squares regression. We also want to know which of these explanatory variables predicts GPA better. Give numerical measures that answer these questions. (Round your answers to three decimal places.) (Regressor: IQ) R 2 (Regressor: Self-Concept) R 2 Which variable is the better predictor? IQ Self Concept obs gpa iq gender concept 1 7.94 112 ...
Please show all work and explain here is the data and explanation of 12.4 here is appendix D
 please show all work and explain
here is the data and explanation of 12.4
here is appendix D
12.12. * In Problem 12.4, find the value of x2. If the dice really are true, what is the probability of getting a value of X2this large or larger? Explain whether the evidence suggests the dice are loaded. (See Appendix D for the necessary probabili- ties.) 12.4.I throw three dice together a total of 400 times, record the number of sixes in...
please show all work and explain
here is the data and explanation of 12.4
here is appendix D
12.12. * In Problem 12.4, find the value of x2. If the dice really are true, what is the probability of getting a value of X2this large or larger? Explain whether the evidence suggests the dice are loaded. (See Appendix D for the necessary probabili- ties.) 12.4.I throw three dice together a total of 400 times, record the number of sixes in...
 (3.46) Here are the IQ test scores of 31 seventh-grade girls in a Midwest school district: 14 100 104 89 102 91 114 114 103 105 108 130 120 132 1 128 18 119 8672 1 103 74 112 107 103 9896 112 112 93 Data Set eBook Step 1 We expect IQ scores to be approximately Normal Make a stemplot to check that there are no major departures from Normality. Use stems with units of tenths. Match your results...
 please do all parts and be neat. i will give good
rating!
It is estimated that the average test score for a statistics exam will be u = 70, with a variance of o2 = 12. In a random sample of 8 students, the test scores are 65, 73, 74, 68, 70, 74, 69, 71, giving us the sample statistics i = 70.5 and s? = 10. Assume a normal distribution of scores. Answer the following questions to determine if...
please do all parts and be neat. i will give good
rating!
It is estimated that the average test score for a statistics exam will be u = 70, with a variance of o2 = 12. In a random sample of 8 students, the test scores are 65, 73, 74, 68, 70, 74, 69, 71, giving us the sample statistics i = 70.5 and s? = 10. Assume a normal distribution of scores. Answer the following questions to determine if...
 please show all work and explain
here is the data and explanation of 12.4
here is appendix D
12.12. * In Problem 12.4, find the value of x2. If the dice really are true, what is the probability of getting a value of X2this large or larger? Explain whether the evidence suggests the dice are loaded. (See Appendix D for the necessary probabili- ties.) 12.4.I throw three dice together a total of 400 times, record the number of sixes in...
please show all work and explain
here is the data and explanation of 12.4
here is appendix D
12.12. * In Problem 12.4, find the value of x2. If the dice really are true, what is the probability of getting a value of X2this large or larger? Explain whether the evidence suggests the dice are loaded. (See Appendix D for the necessary probabili- ties.) 12.4.I throw three dice together a total of 400 times, record the number of sixes in...
Most questions answered within 3 hours.
-
A pair of fair dice is tossed. Let X denote the larger of the
two numbers...
asked 5 minutes ago -
What are the variety of forms of products dispensed with aerosol
spray?
asked 9 minutes ago -
Which one of the following statements is true about C++
keywords?
a. A keyword can have...
asked 9 minutes ago -
Pyruvate Kinase, an allosteric enzyme, accelerates the
conversion of phosphoenolpyruvate to pyruvate.
1) Draw curves describing...
asked 12 minutes ago -
question 1
Which of the following is an example of a bottom-up technique
for developing promotional...
asked 29 minutes ago -
1)In FM modulation, what aspect of the carrier is being
modulated?
2)Explain in your own words,...
asked 25 minutes ago -
Andromeda Galaxy, M31, is considered a sister galaxy to Milky
Way galaxy. One similarirty is their...
asked 31 minutes ago -
How does temperature affect ADH during enzyme
kinetics?
asked 39 minutes ago -
A $1000 par value convertible bond has a conversion price of
$25. It is currently selling...
asked 47 minutes ago -
Write a java program that declares 10 element array (of type
integers), creates and initializes the...
asked 45 minutes ago -
import java.util.Arrays;
import java.util.Random;
import java.util.Scanner;
/**
* TODO Write a summary of the role of...
asked 50 minutes ago -
Sodium hydroxide is a strong base and ammonium hydroxide is a
weak base. Which of the...
asked 55 minutes ago