

Homework Answers
Answer to the question)
.

.
part f)
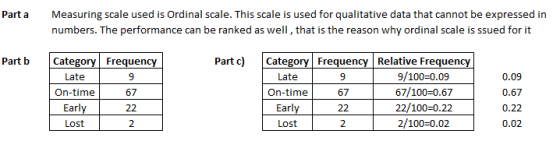
The first objective of the company is that 99% of the delivery should be on time
But we observe that 9% of the parcels are still delivered late
hence this objective is not met
Another objective is that no parcel should be lost
But 2% of the parcels are lost
Hence this objective of the company is also not met
Add Answer to:
Just #26 please
Like planned activities Do not like planned activities Not sure No answer 24...
930. (24 pts) Page 44. Problem 30: a, b,c. d. 30. The following data give the...
 930. (24 pts) Page 44. Problem 30: a, b,c. d. 30. The following data give the weekly amounts spent on groceries for a sample of 45 households $271 $33 $159 76 $227 $337 $295 $319 $250 162 232 303 41 335 170 188 320 279 192 116 429 205 181 100 294 279 266 321 151 240 474 297 570 342 279 235 434 123 325 199 246 309 278 50 a. How many classes would you recommend? b. What...
Can you please help me to find the percent part of this assignment and please check...
 Can you please help me to find the percent part of this
assignment and please check the degree part. Thank you !
credit; no work, no e (Need to show all your work to get full 1. For the given sample data below: Construct a frequency distribution using six classes for a sample data that includes Class Limits (5 pts), Class Boundaries (6 pts), Frequency (3 pts), Relative frequency (3 pts) Cumulative Frequency (3 pts), Midpoint Xn (S pts), xn(5...
Can you please help me to find the percent part of this
assignment and please check the degree part. Thank you !
credit; no work, no e (Need to show all your work to get full 1. For the given sample data below: Construct a frequency distribution using six classes for a sample data that includes Class Limits (5 pts), Class Boundaries (6 pts), Frequency (3 pts), Relative frequency (3 pts) Cumulative Frequency (3 pts), Midpoint Xn (S pts), xn(5...
Please answer all questions! thanks :) VI/ Test scores from a math midterm are as follows:...
 Please
answer all questions! thanks :)
VI/ Test scores from a math midterm are as follows: 79, 90, 85, 89, 70, 59, 75, 64, 83, 78, 75, 77, 78, 77, 67, 85, 74, 52, 87, 72, 69, 76, 61, 77, 93, 86, 79, 90, 74, 67, 51, 75, 77, 82, 78, 60, 86, 72, 91, 95, 82 Complete the frequency distribution table to include all data a. Class Tallies Class Midpoint Relative Cumulative Frequency relative freq boundaries Frequency 51 57...
Please
answer all questions! thanks :)
VI/ Test scores from a math midterm are as follows: 79, 90, 85, 89, 70, 59, 75, 64, 83, 78, 75, 77, 78, 77, 67, 85, 74, 52, 87, 72, 69, 76, 61, 77, 93, 86, 79, 90, 74, 67, 51, 75, 77, 82, 78, 60, 86, 72, 91, 95, 82 Complete the frequency distribution table to include all data a. Class Tallies Class Midpoint Relative Cumulative Frequency relative freq boundaries Frequency 51 57...
little lose on step #3 1. The following data set represents the amount spent (in dollars)...
 little lose on step #3
1. The following data set represents the amount spent (in dollars) by 45 shoppers at a supermarket. Construct a frequency distribution for the variable, and also report the relative frequencies for each class in your frequency distribution. NOTE: the data is in dollars and cents; you can not change that data! 1081, 1269, 1378, 15.23, 15.62. 17.00, 17.39. 18.36. 1843. 1927, 19.50.1954. 20.16, 20.59, 22.22, 23.04, 2447. 24.58, 25.13, 26.24.26.26, 27.65, 28.06, 28.08, 28.38, 32.03,...
little lose on step #3
1. The following data set represents the amount spent (in dollars) by 45 shoppers at a supermarket. Construct a frequency distribution for the variable, and also report the relative frequencies for each class in your frequency distribution. NOTE: the data is in dollars and cents; you can not change that data! 1081, 1269, 1378, 15.23, 15.62. 17.00, 17.39. 18.36. 1843. 1927, 19.50.1954. 20.16, 20.59, 22.22, 23.04, 2447. 24.58, 25.13, 26.24.26.26, 27.65, 28.06, 28.08, 28.38, 32.03,...
Just 34 please CHAPTER 2 33. You are exploring the music in your iTunes library. The...
 Just 34 please
CHAPTER 2 33. You are exploring the music in your iTunes library. The total play counts over the past year for the 27 songs on your "smart playlist" are shown below. Make a frequency distribution of the counts and describe its shape. It is often claimed that a small fraction of a person's songs will account for most of their total plays. Does this seem to be the case here? ILE, please vist 128 58 54 91...
Just 34 please
CHAPTER 2 33. You are exploring the music in your iTunes library. The total play counts over the past year for the 27 songs on your "smart playlist" are shown below. Make a frequency distribution of the counts and describe its shape. It is often claimed that a small fraction of a person's songs will account for most of their total plays. Does this seem to be the case here? ILE, please vist 128 58 54 91...
Please show work, thank you "I'm not sure we should lay out $310,000 for that automated...
 Please show work, thank you
"I'm not sure we should lay out $310,000 for that automated welding machine," said Jim Alder, president of the Superior Equipment Company. "That's a lot of money, and it would cost us another $50,400 per year just to maintain the thing. In addition, the manufacturer admits it would cost $49,000 more at the end of three years to replace worn-out parts." $86,000 for software and installation, and "I admit it's a lot of money," said...
Please show work, thank you
"I'm not sure we should lay out $310,000 for that automated welding machine," said Jim Alder, president of the Superior Equipment Company. "That's a lot of money, and it would cost us another $50,400 per year just to maintain the thing. In addition, the manufacturer admits it would cost $49,000 more at the end of three years to replace worn-out parts." $86,000 for software and installation, and "I admit it's a lot of money," said...
Answer question 1 & 2 asap please Below are the times (in days) it takes for...
 Answer question 1 & 2 asap please
Below are the times (in days) it takes for a sample of 17 customers from Sarah's computer store to pay their invoices. 19, 15,43, 39, 35, 31, 27, 22, 18, 30, 30, 30, 26, 26, 21, 21, 17 Draw the histogram for these data using an initial class boundary of 14.5 and a class width of 7. Note that you can add or remove classes from the figure. Label each class with its...
Answer question 1 & 2 asap please
Below are the times (in days) it takes for a sample of 17 customers from Sarah's computer store to pay their invoices. 19, 15,43, 39, 35, 31, 27, 22, 18, 30, 30, 30, 26, 26, 21, 21, 17 Draw the histogram for these data using an initial class boundary of 14.5 and a class width of 7. Note that you can add or remove classes from the figure. Label each class with its...
need problems 1-10 Chapter Quick Quiz 1. When one is constructing a table representing the frequency...
 need problems 1-10
Chapter Quick Quiz 1. When one is constructing a table representing the frequency distribution of weights (b) discarded textile items from Data Set 23 in Appendix B, the first two classes of a frequen distribution are 0.00-0.99 and 1.00-1.99. What is the class width? 2. Using the same first two classes from Exercise 1, identify the class boundaries of the first class 3. The first class described in Exercise 1 has a frequency of 51. If you...
need problems 1-10
Chapter Quick Quiz 1. When one is constructing a table representing the frequency distribution of weights (b) discarded textile items from Data Set 23 in Appendix B, the first two classes of a frequen distribution are 0.00-0.99 and 1.00-1.99. What is the class width? 2. Using the same first two classes from Exercise 1, identify the class boundaries of the first class 3. The first class described in Exercise 1 has a frequency of 51. If you...
Assume you are interested in determining if reaction times to identify letters presented on a computer...
 Assume you are interested in determining if reaction times to identify letters presented on a computer screen differ according to time of day. You present the subjects in your study with a letter and measure how long it takes them to push a key on a keyboard in front of them (i.e. you measure their reaction time in milliseconds). Below is a set of reaction time data collected from 25 students in the late afternoon. 1) Construct a grouped frequency...
On the Spot Courier Services. On the Spot courier services grew and changed over the years....
On the Spot Courier Services. On the Spot courier services grew and changed over the years. At first, Bill received requests for package pickups on his mobile phone, recorded that informa- tion in a log, and would then drive around to retrieve all the packages later in the day. However, he soon discovered that with another driver, it was difficult to coordinate pickups between the two of them from his van. It was not long before he reorganized his business...
 930. (24 pts) Page 44. Problem 30: a, b,c. d. 30. The following data give the weekly amounts spent on groceries for a sample of 45 households $271 $33 $159 76 $227 $337 $295 $319 $250 162 232 303 41 335 170 188 320 279 192 116 429 205 181 100 294 279 266 321 151 240 474 297 570 342 279 235 434 123 325 199 246 309 278 50 a. How many classes would you recommend? b. What...
 Can you please help me to find the percent part of this
assignment and please check the degree part. Thank you !
credit; no work, no e (Need to show all your work to get full 1. For the given sample data below: Construct a frequency distribution using six classes for a sample data that includes Class Limits (5 pts), Class Boundaries (6 pts), Frequency (3 pts), Relative frequency (3 pts) Cumulative Frequency (3 pts), Midpoint Xn (S pts), xn(5...
Can you please help me to find the percent part of this
assignment and please check the degree part. Thank you !
credit; no work, no e (Need to show all your work to get full 1. For the given sample data below: Construct a frequency distribution using six classes for a sample data that includes Class Limits (5 pts), Class Boundaries (6 pts), Frequency (3 pts), Relative frequency (3 pts) Cumulative Frequency (3 pts), Midpoint Xn (S pts), xn(5...
 Please
answer all questions! thanks :)
VI/ Test scores from a math midterm are as follows: 79, 90, 85, 89, 70, 59, 75, 64, 83, 78, 75, 77, 78, 77, 67, 85, 74, 52, 87, 72, 69, 76, 61, 77, 93, 86, 79, 90, 74, 67, 51, 75, 77, 82, 78, 60, 86, 72, 91, 95, 82 Complete the frequency distribution table to include all data a. Class Tallies Class Midpoint Relative Cumulative Frequency relative freq boundaries Frequency 51 57...
Please
answer all questions! thanks :)
VI/ Test scores from a math midterm are as follows: 79, 90, 85, 89, 70, 59, 75, 64, 83, 78, 75, 77, 78, 77, 67, 85, 74, 52, 87, 72, 69, 76, 61, 77, 93, 86, 79, 90, 74, 67, 51, 75, 77, 82, 78, 60, 86, 72, 91, 95, 82 Complete the frequency distribution table to include all data a. Class Tallies Class Midpoint Relative Cumulative Frequency relative freq boundaries Frequency 51 57...
 little lose on step #3
1. The following data set represents the amount spent (in dollars) by 45 shoppers at a supermarket. Construct a frequency distribution for the variable, and also report the relative frequencies for each class in your frequency distribution. NOTE: the data is in dollars and cents; you can not change that data! 1081, 1269, 1378, 15.23, 15.62. 17.00, 17.39. 18.36. 1843. 1927, 19.50.1954. 20.16, 20.59, 22.22, 23.04, 2447. 24.58, 25.13, 26.24.26.26, 27.65, 28.06, 28.08, 28.38, 32.03,...
little lose on step #3
1. The following data set represents the amount spent (in dollars) by 45 shoppers at a supermarket. Construct a frequency distribution for the variable, and also report the relative frequencies for each class in your frequency distribution. NOTE: the data is in dollars and cents; you can not change that data! 1081, 1269, 1378, 15.23, 15.62. 17.00, 17.39. 18.36. 1843. 1927, 19.50.1954. 20.16, 20.59, 22.22, 23.04, 2447. 24.58, 25.13, 26.24.26.26, 27.65, 28.06, 28.08, 28.38, 32.03,...
 Just 34 please
CHAPTER 2 33. You are exploring the music in your iTunes library. The total play counts over the past year for the 27 songs on your "smart playlist" are shown below. Make a frequency distribution of the counts and describe its shape. It is often claimed that a small fraction of a person's songs will account for most of their total plays. Does this seem to be the case here? ILE, please vist 128 58 54 91...
Just 34 please
CHAPTER 2 33. You are exploring the music in your iTunes library. The total play counts over the past year for the 27 songs on your "smart playlist" are shown below. Make a frequency distribution of the counts and describe its shape. It is often claimed that a small fraction of a person's songs will account for most of their total plays. Does this seem to be the case here? ILE, please vist 128 58 54 91...
 Please show work, thank you
"I'm not sure we should lay out $310,000 for that automated welding machine," said Jim Alder, president of the Superior Equipment Company. "That's a lot of money, and it would cost us another $50,400 per year just to maintain the thing. In addition, the manufacturer admits it would cost $49,000 more at the end of three years to replace worn-out parts." $86,000 for software and installation, and "I admit it's a lot of money," said...
Please show work, thank you
"I'm not sure we should lay out $310,000 for that automated welding machine," said Jim Alder, president of the Superior Equipment Company. "That's a lot of money, and it would cost us another $50,400 per year just to maintain the thing. In addition, the manufacturer admits it would cost $49,000 more at the end of three years to replace worn-out parts." $86,000 for software and installation, and "I admit it's a lot of money," said...
 Answer question 1 & 2 asap please
Below are the times (in days) it takes for a sample of 17 customers from Sarah's computer store to pay their invoices. 19, 15,43, 39, 35, 31, 27, 22, 18, 30, 30, 30, 26, 26, 21, 21, 17 Draw the histogram for these data using an initial class boundary of 14.5 and a class width of 7. Note that you can add or remove classes from the figure. Label each class with its...
Answer question 1 & 2 asap please
Below are the times (in days) it takes for a sample of 17 customers from Sarah's computer store to pay their invoices. 19, 15,43, 39, 35, 31, 27, 22, 18, 30, 30, 30, 26, 26, 21, 21, 17 Draw the histogram for these data using an initial class boundary of 14.5 and a class width of 7. Note that you can add or remove classes from the figure. Label each class with its...
 need problems 1-10
Chapter Quick Quiz 1. When one is constructing a table representing the frequency distribution of weights (b) discarded textile items from Data Set 23 in Appendix B, the first two classes of a frequen distribution are 0.00-0.99 and 1.00-1.99. What is the class width? 2. Using the same first two classes from Exercise 1, identify the class boundaries of the first class 3. The first class described in Exercise 1 has a frequency of 51. If you...
need problems 1-10
Chapter Quick Quiz 1. When one is constructing a table representing the frequency distribution of weights (b) discarded textile items from Data Set 23 in Appendix B, the first two classes of a frequen distribution are 0.00-0.99 and 1.00-1.99. What is the class width? 2. Using the same first two classes from Exercise 1, identify the class boundaries of the first class 3. The first class described in Exercise 1 has a frequency of 51. If you...
 Assume you are interested in determining if reaction times to identify letters presented on a computer screen differ according to time of day. You present the subjects in your study with a letter and measure how long it takes them to push a key on a keyboard in front of them (i.e. you measure their reaction time in milliseconds). Below is a set of reaction time data collected from 25 students in the late afternoon. 1) Construct a grouped frequency...
Most questions answered within 3 hours.
-
Calculate Ecell for the following reaction and conditions: 0.50
M Br2 (aq), 0.10 M Pb+2 (aq),...
asked 5 minutes ago -
There can be more than one correct answer.
Hypophysiotropic hormones:
A. released by the hypothalamus
B....
asked 10 minutes ago -
Scott Ruskin is the CEO of Decatur Materials. The company has
been struggling for the last...
asked 8 minutes ago -
If you were conducting a study involving twins regarding
genetics and/or upbringing, which would you use?...
asked 30 minutes ago -
Part 1- Inventory: You own a toy company and
you are producing wooden rocking horses. Assume...
asked 39 minutes ago -
What is aromaticity?
Identify aromatic molecules, especially those containing O, N,
S and B
asked 42 minutes ago -
A rubber solid circular wheel of uniform density spins about it
axis at rate of 60...
asked 54 minutes ago -
DNA evidence from an early human skeleton in Britain, shows that
early inhabitants of were blue...
asked 45 minutes ago -
Financial data for Joel de Paris, Inc., for last year
follow:
Joel de Paris, Inc.
Balance...
asked 53 minutes ago -
To practice Problem-Solving Strategy 19.1 Work in Ideal-gas
Processes.
A cylinder with initial volume V contains...
asked 1 hour ago -
Depreciation for Partial Periods Bean Delivery Company purchased
a new delivery truck for $35,400 on April...
asked 1 hour ago -
Q 5.23:
Jonathan has been doing calculations to determine a missing
component. So far he has...
asked 1 hour ago