

Homework Answers
Q1
Given data of 17 customer Sarah computer store is as follow
19 15 43 39 35 31 27 22 18 30 30 30 26 26 21 21 27
Sorted data is as follow : - 15 18 19 21 21 22 26 26 27 27 30 30 30 31 35 39 43
To draw histogram of these data
We need take initial class boundry of 14.5 , and class width of 7
Class interval (or boundry) will be as follow :- 14.5 - 21.5 , 21.5 - 28.5 and so on
Table
| Class inteval | Frequency |
| 14.5 - 21.5 | 5 |
| 21.5 - 28.5 | 5 |
| 28.5 - 35.5 | 5 |
| 35.5 - 42.5 | 1 |
| 42.5 - above | 1 |
{ Note that we will plot histogram using R-software , similar plot can be drawn mannualy as required above }

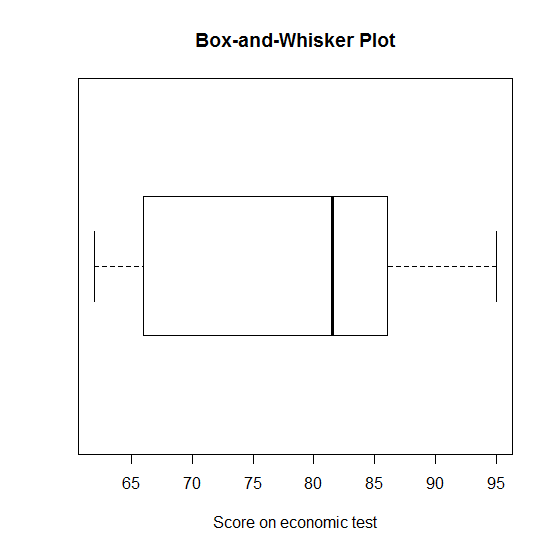
Q2
Data of grade of 18 students on an economic test is as follow
66,62,81,76,82,84,64,95,90,73,66,84,85,91,86,63,80,92
To construct box-and-whisker plot of the data
Now 5-number summary of above data in as follow
# Using R
> summary(x)
Min. 1st Qu. Median
Mean 3rd Qu. Max.
62.00 67.75 81.50 78.89
85.75 95.00
{ Note that - Here cannot determine which tools are provided , so we will constuct box-and-whisker plot using R , similar boxplot can be drawn manually or in format given above . }
Add Answer to:
Answer question 1 & 2 asap please
Below are the times (in days) it takes for...
Below are the times (in days) it takes for a sample of 21 customers from Sarah's...
Below are the times (in days) it takes for a sample of 21 customers from Sarah's computer store to pay their invoices. 19, 15, 43, 39, 35, 31, 27, 22, 18, 14, 42, 38, 34, 30, 26, 41, 41, 37, 37, 37, 33 Draw the histogram for these data using an initial class boundary of 13.5, an ending class boundary of 48.5, and 5 classes of equal width. Note that you can add or remove classes from the figure. Label...
Below are the times in days) it takes for a sample of 19 customers from Andrew's...
 Below are the times in days) it takes for a sample of 19 customers from Andrew's computer store to pay their invoices. 19, 15, 43, 39, 35, 31, 27, 22, 18, 14, 42, 21, 21, 21, 17, 17, 17, 13, 13 Draw the histogram for these data using an initial class boundary of 12.5, an ending class boundary of 47.5, and 5 classes of equal width. Note that you can add or remove classes from the figure. Label each class...
Below are the times (in days) it takes for a sample of 22 customers from Jack's...
 Below are the times (in days) it takes for a sample of 22 customers from Jack's computer store to pay their invoices. 19, 15, 43, 39, 35, 31, 27, 22, 18, 14, 42, 38, 34, 30, 26, 21, 37, 37, 37, 33, 33, 33 Draw the histogram for these data using an initial class boundary of 13.5, an ending class boundary of 48.5, and 5 classes of equal width. Note that you can add or remove classes from the figure....
-1 5 7 8 9 10 11 12 13 Below are the times (in days) it...
 -1 5 7 8 9 10 11 12 13 Below are the times (in days) it takes for a sample of 16 customers from Sarah's computer store to pay their invoices. 19,15,43, 39, 35, 31, 27, 22, 34, 34, 34, 30, 30, 30, 26, 26 Draw the frequency polygon for these data using an initial class boundary of 14.5 and a class width of 7. Note that you can add or remove classes from the figure. Label each class with...
- 5 8 9 - 10 - 11 12 - 13 14 15 16 Below are...
 - 5 8 9 - 10 - 11 12 - 13 14 15 16 Below are the times (in days) it takes for a sample of 16 customers from Sarah's computer store to pay their invoices. 19,15,43, 39, 35, 31, 27, 22, 34, 34, 34, 30, 30, 30, 26, 26 Draw the frequency polygon for these data using an initial class boundary of 14.5 and a class width of 7. Note that you can add or remove classes from the...
neat Hand writing gets a thumbs Up ! 6. Below are the times (in days) it...
 neat Hand writing gets a thumbs Up !
6.
Below are the times (in days) it takes for a sample of 18 customers from Jack's computer store to pay their invoices. 19, 15, 43, 39, 35, 31, 27, 22, 18, 14, 26, 26, 26, 21, 21, 21, 17, 17 Draw the frequency polygon for these data using an initial class boundary of 13.5, an ending class boundary of 48.5 and 5 classes of equal width. Note that you can add...
neat Hand writing gets a thumbs Up !
6.
Below are the times (in days) it takes for a sample of 18 customers from Jack's computer store to pay their invoices. 19, 15, 43, 39, 35, 31, 27, 22, 18, 14, 26, 26, 26, 21, 21, 21, 17, 17 Draw the frequency polygon for these data using an initial class boundary of 13.5, an ending class boundary of 48.5 and 5 classes of equal width. Note that you can add...
ASAP. question 1, 2 & 3 please. these are more CLEAR, sorry about that. Q1 The...
 ASAP. question 1, 2 & 3 please.
these are more CLEAR, sorry about that.
Q1 The following is a list of PE ratios (current stock price divided by company's earnings per share) for 23 companies 57,58, 30, 46, 42, 35, 31,56,52,48,48,41,37,34,30,40,40,40,34,36,38,39,13 Draw the stagram for these data using an initial class boundary of 295 and a dess width of 6. Note that you can add or remove classes from the figure. Label each class with its endpoints. 0:1 1:0 0...
ASAP. question 1, 2 & 3 please.
these are more CLEAR, sorry about that.
Q1 The following is a list of PE ratios (current stock price divided by company's earnings per share) for 23 companies 57,58, 30, 46, 42, 35, 31,56,52,48,48,41,37,34,30,40,40,40,34,36,38,39,13 Draw the stagram for these data using an initial class boundary of 295 and a dess width of 6. Note that you can add or remove classes from the figure. Label each class with its endpoints. 0:1 1:0 0...
3 6 7 8 9 10 11 12 13 14 Here are the shopping times (in...
 3 6 7 8 9 10 11 12 13 14 Here are the shopping times (in minutes) for a sample of 21 shoppers at a particular computer store: 26, 23, 44, 41, 38, 35, 31,28,25, 22, 43, 24, 24, 21, 21, 21, 43, 43, 39, 39, 39 Draw the histogram for these data using an initial class boundary of 20.5, an ending class boundary of 45.5, and 5 classes of įqual width. Note that you can add or remove classes...
Please show how you did this in excel. :13-19 Every home football game for the past...
 Please show how you did this in excel.
:13-19 Every home football game for the past eight years at Eastern State University has been sold out. The revenues from ticket sales are significant, but the sale of food, beverages, and souvenirs has contrib- uted greatly to the overall profitability of the football program. One particular souvenir is the football pro- gram for each game. The number of programs sold at each game is described by the following probabil- ity distribution:...
Please show how you did this in excel.
:13-19 Every home football game for the past eight years at Eastern State University has been sold out. The revenues from ticket sales are significant, but the sale of food, beverages, and souvenirs has contrib- uted greatly to the overall profitability of the football program. One particular souvenir is the football pro- gram for each game. The number of programs sold at each game is described by the following probabil- ity distribution:...
(3) Determine the class interval (Cl), the width of classes of it may be the difference two succe...
 (3) Determine the class interval (Cl), the width of classes of it may be the difference two succeeding class midpoints (CM). The CM is the average between the limits of a class. For each computation, CI must be a whole number. It can be obtained by the equation CI-R/K-101.5/10-10.15 (4) Take the frequency distribution for each set of data On the basis of this method, the frequency distribution is as follows: Table 8.1. Frequency Distribution Class Total P PFF 41...
 Below are the times in days) it takes for a sample of 19 customers from Andrew's computer store to pay their invoices. 19, 15, 43, 39, 35, 31, 27, 22, 18, 14, 42, 21, 21, 21, 17, 17, 17, 13, 13 Draw the histogram for these data using an initial class boundary of 12.5, an ending class boundary of 47.5, and 5 classes of equal width. Note that you can add or remove classes from the figure. Label each class...
 Below are the times (in days) it takes for a sample of 22 customers from Jack's computer store to pay their invoices. 19, 15, 43, 39, 35, 31, 27, 22, 18, 14, 42, 38, 34, 30, 26, 21, 37, 37, 37, 33, 33, 33 Draw the histogram for these data using an initial class boundary of 13.5, an ending class boundary of 48.5, and 5 classes of equal width. Note that you can add or remove classes from the figure....
 -1 5 7 8 9 10 11 12 13 Below are the times (in days) it takes for a sample of 16 customers from Sarah's computer store to pay their invoices. 19,15,43, 39, 35, 31, 27, 22, 34, 34, 34, 30, 30, 30, 26, 26 Draw the frequency polygon for these data using an initial class boundary of 14.5 and a class width of 7. Note that you can add or remove classes from the figure. Label each class with...
 - 5 8 9 - 10 - 11 12 - 13 14 15 16 Below are the times (in days) it takes for a sample of 16 customers from Sarah's computer store to pay their invoices. 19,15,43, 39, 35, 31, 27, 22, 34, 34, 34, 30, 30, 30, 26, 26 Draw the frequency polygon for these data using an initial class boundary of 14.5 and a class width of 7. Note that you can add or remove classes from the...
 neat Hand writing gets a thumbs Up !
6.
Below are the times (in days) it takes for a sample of 18 customers from Jack's computer store to pay their invoices. 19, 15, 43, 39, 35, 31, 27, 22, 18, 14, 26, 26, 26, 21, 21, 21, 17, 17 Draw the frequency polygon for these data using an initial class boundary of 13.5, an ending class boundary of 48.5 and 5 classes of equal width. Note that you can add...
neat Hand writing gets a thumbs Up !
6.
Below are the times (in days) it takes for a sample of 18 customers from Jack's computer store to pay their invoices. 19, 15, 43, 39, 35, 31, 27, 22, 18, 14, 26, 26, 26, 21, 21, 21, 17, 17 Draw the frequency polygon for these data using an initial class boundary of 13.5, an ending class boundary of 48.5 and 5 classes of equal width. Note that you can add...
 ASAP. question 1, 2 & 3 please.
these are more CLEAR, sorry about that.
Q1 The following is a list of PE ratios (current stock price divided by company's earnings per share) for 23 companies 57,58, 30, 46, 42, 35, 31,56,52,48,48,41,37,34,30,40,40,40,34,36,38,39,13 Draw the stagram for these data using an initial class boundary of 295 and a dess width of 6. Note that you can add or remove classes from the figure. Label each class with its endpoints. 0:1 1:0 0...
ASAP. question 1, 2 & 3 please.
these are more CLEAR, sorry about that.
Q1 The following is a list of PE ratios (current stock price divided by company's earnings per share) for 23 companies 57,58, 30, 46, 42, 35, 31,56,52,48,48,41,37,34,30,40,40,40,34,36,38,39,13 Draw the stagram for these data using an initial class boundary of 295 and a dess width of 6. Note that you can add or remove classes from the figure. Label each class with its endpoints. 0:1 1:0 0...
 3 6 7 8 9 10 11 12 13 14 Here are the shopping times (in minutes) for a sample of 21 shoppers at a particular computer store: 26, 23, 44, 41, 38, 35, 31,28,25, 22, 43, 24, 24, 21, 21, 21, 43, 43, 39, 39, 39 Draw the histogram for these data using an initial class boundary of 20.5, an ending class boundary of 45.5, and 5 classes of įqual width. Note that you can add or remove classes...
 Please show how you did this in excel.
:13-19 Every home football game for the past eight years at Eastern State University has been sold out. The revenues from ticket sales are significant, but the sale of food, beverages, and souvenirs has contrib- uted greatly to the overall profitability of the football program. One particular souvenir is the football pro- gram for each game. The number of programs sold at each game is described by the following probabil- ity distribution:...
Please show how you did this in excel.
:13-19 Every home football game for the past eight years at Eastern State University has been sold out. The revenues from ticket sales are significant, but the sale of food, beverages, and souvenirs has contrib- uted greatly to the overall profitability of the football program. One particular souvenir is the football pro- gram for each game. The number of programs sold at each game is described by the following probabil- ity distribution:...
 (3) Determine the class interval (Cl), the width of classes of it may be the difference two succeeding class midpoints (CM). The CM is the average between the limits of a class. For each computation, CI must be a whole number. It can be obtained by the equation CI-R/K-101.5/10-10.15 (4) Take the frequency distribution for each set of data On the basis of this method, the frequency distribution is as follows: Table 8.1. Frequency Distribution Class Total P PFF 41...
Most questions answered within 3 hours.
-
A study of the effects of exercise used rats bred to have high
or low capacity...
asked 10 minutes ago -
Using your data from the experiment, calculate the initial moles
of HCl that you started with....
asked 11 minutes ago -
Suppose you want to make 500 mL of a 0.20 M Tris buffer at pH
8.0....
asked 12 minutes ago -
The titanic hit an iceberg estimated to be half of her mass.
Before hitting the iceberg,...
asked 33 minutes ago -
3. The top four firms in Industry A have market shares of 30,
25, 10, and...
asked 37 minutes ago -
Are there such things as microscopic multicellular animal
parasites? If so, please give examples.
asked 1 hour ago -
1. What two structures in the ear are involved in your
sense of balance and in...
asked 58 minutes ago -
Two ice skaters suddenly push off against one another starting
from a stationary position. The 45...
asked 59 minutes ago -
What is the Larmor frequency for a proton in a magnetic field of
B0 = 14.0...
asked 1 hour ago -
Problem 03.019 Annual Worth Calculations
Find the value of x that makes the equivalent annual
worth...
asked 1 hour ago -
Under common law, right of survivorship was automatically a
feature of which type of co-tenancy?
a....
asked 1 hour ago -
At 1 bar, how much energy is required to heat 61.0 g of H2O(s)
at −12.0...
asked 1 hour ago