
Homework Answers
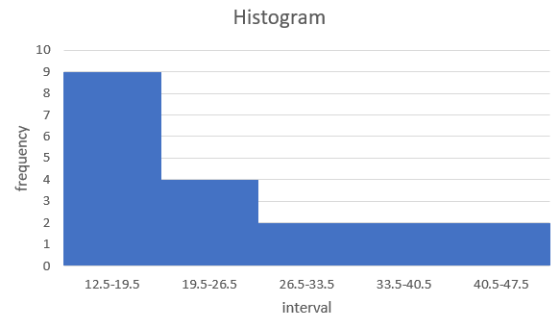
| lower boundary | upper boundary | frequency | ||||
| 12.5 | 19.5 | 9 | ||||
| 19.5 | 26.5 | 4 | ||||
| 26.5 | 33.5 | 2 | ||||
| 33.5 | 40.5 | 2 | ||||
| 40.5 | 47.5 | 2 |
Add Answer to:
Below are the times in days) it takes for a sample of 19 customers from Andrew's...
Below are the times (in days) it takes for a sample of 21 customers from Sarah's...
Below are the times (in days) it takes for a sample of 21 customers from Sarah's computer store to pay their invoices. 19, 15, 43, 39, 35, 31, 27, 22, 18, 14, 42, 38, 34, 30, 26, 41, 41, 37, 37, 37, 33 Draw the histogram for these data using an initial class boundary of 13.5, an ending class boundary of 48.5, and 5 classes of equal width. Note that you can add or remove classes from the figure. Label...
Below are the times (in days) it takes for a sample of 22 customers from Jack's...
 Below are the times (in days) it takes for a sample of 22 customers from Jack's computer store to pay their invoices. 19, 15, 43, 39, 35, 31, 27, 22, 18, 14, 42, 38, 34, 30, 26, 21, 37, 37, 37, 33, 33, 33 Draw the histogram for these data using an initial class boundary of 13.5, an ending class boundary of 48.5, and 5 classes of equal width. Note that you can add or remove classes from the figure....
Answer question 1 & 2 asap please Below are the times (in days) it takes for...
 Answer question 1 & 2 asap please
Below are the times (in days) it takes for a sample of 17 customers from Sarah's computer store to pay their invoices. 19, 15,43, 39, 35, 31, 27, 22, 18, 30, 30, 30, 26, 26, 21, 21, 17 Draw the histogram for these data using an initial class boundary of 14.5 and a class width of 7. Note that you can add or remove classes from the figure. Label each class with its...
Answer question 1 & 2 asap please
Below are the times (in days) it takes for a sample of 17 customers from Sarah's computer store to pay their invoices. 19, 15,43, 39, 35, 31, 27, 22, 18, 30, 30, 30, 26, 26, 21, 21, 17 Draw the histogram for these data using an initial class boundary of 14.5 and a class width of 7. Note that you can add or remove classes from the figure. Label each class with its...
neat Hand writing gets a thumbs Up ! 6. Below are the times (in days) it...
 neat Hand writing gets a thumbs Up !
6.
Below are the times (in days) it takes for a sample of 18 customers from Jack's computer store to pay their invoices. 19, 15, 43, 39, 35, 31, 27, 22, 18, 14, 26, 26, 26, 21, 21, 21, 17, 17 Draw the frequency polygon for these data using an initial class boundary of 13.5, an ending class boundary of 48.5 and 5 classes of equal width. Note that you can add...
neat Hand writing gets a thumbs Up !
6.
Below are the times (in days) it takes for a sample of 18 customers from Jack's computer store to pay their invoices. 19, 15, 43, 39, 35, 31, 27, 22, 18, 14, 26, 26, 26, 21, 21, 21, 17, 17 Draw the frequency polygon for these data using an initial class boundary of 13.5, an ending class boundary of 48.5 and 5 classes of equal width. Note that you can add...
3 6 7 8 9 10 11 12 13 14 Here are the shopping times (in...
 3 6 7 8 9 10 11 12 13 14 Here are the shopping times (in minutes) for a sample of 21 shoppers at a particular computer store: 26, 23, 44, 41, 38, 35, 31,28,25, 22, 43, 24, 24, 21, 21, 21, 43, 43, 39, 39, 39 Draw the histogram for these data using an initial class boundary of 20.5, an ending class boundary of 45.5, and 5 classes of įqual width. Note that you can add or remove classes...
-1 5 7 8 9 10 11 12 13 Below are the times (in days) it...
 -1 5 7 8 9 10 11 12 13 Below are the times (in days) it takes for a sample of 16 customers from Sarah's computer store to pay their invoices. 19,15,43, 39, 35, 31, 27, 22, 34, 34, 34, 30, 30, 30, 26, 26 Draw the frequency polygon for these data using an initial class boundary of 14.5 and a class width of 7. Note that you can add or remove classes from the figure. Label each class with...
P4xcvcZN2HQDRJQiWdax1PZm2.. O STATISTICS Histograms for grouped data Here are the shopping times in minutes) for a...
 P4xcvcZN2HQDRJQiWdax1PZm2.. O STATISTICS Histograms for grouped data Here are the shopping times in minutes) for a sample of 22 shoppers at a particular grocery store: 26, 23, 44, 41, 38, 35, 31, 28, 25, 22, 43, 40, 21, 21, 21, 43, 43, 43, 39, 39, 36, 36 Draw the histogram for these data using an initial class boundary of 20.5 and a class width of 5. Note that you can add or remove classes from the figure. Label each class...
- 5 8 9 - 10 - 11 12 - 13 14 15 16 Below are...
 - 5 8 9 - 10 - 11 12 - 13 14 15 16 Below are the times (in days) it takes for a sample of 16 customers from Sarah's computer store to pay their invoices. 19,15,43, 39, 35, 31, 27, 22, 34, 34, 34, 30, 30, 30, 26, 26 Draw the frequency polygon for these data using an initial class boundary of 14.5 and a class width of 7. Note that you can add or remove classes from the...
Here are the shopping times in minutes) for a sample of 22 shoppers at a particular...
 Here are the shopping times in minutes) for a sample of 22 shoppers at a particular computer store: 26, 23, 44, 41, 38, 35, 31, 28, 25, 22, 43, 40, 21, 21, 43, 43, 43, 39, 39, 39, 36, 36 Draw the frequency polygon for these data using an initial class boundary of 20.5 and a class width of 5. Note that you can add or remove classes from the figure. Label each class with its midpoint. Frequency I:lolo:1 8...
The following are the lengths of stay in days) for a random sample of 16 patients...
 The following are the lengths of stay in days) for a random sample of 16 patients discharged from a particular hospital: 11.9.3, 11.6 3.9.9.9.5.5. 12. 12. 12.9.9 Draw the histogram for these data using an initial class boundary of 2.5 and a class width of 2. Note that you can add or remove classes from the figure. Label each dass with its endpoints Frequency 0:0 (0:0
 Below are the times (in days) it takes for a sample of 22 customers from Jack's computer store to pay their invoices. 19, 15, 43, 39, 35, 31, 27, 22, 18, 14, 42, 38, 34, 30, 26, 21, 37, 37, 37, 33, 33, 33 Draw the histogram for these data using an initial class boundary of 13.5, an ending class boundary of 48.5, and 5 classes of equal width. Note that you can add or remove classes from the figure....
 Answer question 1 & 2 asap please
Below are the times (in days) it takes for a sample of 17 customers from Sarah's computer store to pay their invoices. 19, 15,43, 39, 35, 31, 27, 22, 18, 30, 30, 30, 26, 26, 21, 21, 17 Draw the histogram for these data using an initial class boundary of 14.5 and a class width of 7. Note that you can add or remove classes from the figure. Label each class with its...
Answer question 1 & 2 asap please
Below are the times (in days) it takes for a sample of 17 customers from Sarah's computer store to pay their invoices. 19, 15,43, 39, 35, 31, 27, 22, 18, 30, 30, 30, 26, 26, 21, 21, 17 Draw the histogram for these data using an initial class boundary of 14.5 and a class width of 7. Note that you can add or remove classes from the figure. Label each class with its...
 neat Hand writing gets a thumbs Up !
6.
Below are the times (in days) it takes for a sample of 18 customers from Jack's computer store to pay their invoices. 19, 15, 43, 39, 35, 31, 27, 22, 18, 14, 26, 26, 26, 21, 21, 21, 17, 17 Draw the frequency polygon for these data using an initial class boundary of 13.5, an ending class boundary of 48.5 and 5 classes of equal width. Note that you can add...
neat Hand writing gets a thumbs Up !
6.
Below are the times (in days) it takes for a sample of 18 customers from Jack's computer store to pay their invoices. 19, 15, 43, 39, 35, 31, 27, 22, 18, 14, 26, 26, 26, 21, 21, 21, 17, 17 Draw the frequency polygon for these data using an initial class boundary of 13.5, an ending class boundary of 48.5 and 5 classes of equal width. Note that you can add...
 3 6 7 8 9 10 11 12 13 14 Here are the shopping times (in minutes) for a sample of 21 shoppers at a particular computer store: 26, 23, 44, 41, 38, 35, 31,28,25, 22, 43, 24, 24, 21, 21, 21, 43, 43, 39, 39, 39 Draw the histogram for these data using an initial class boundary of 20.5, an ending class boundary of 45.5, and 5 classes of įqual width. Note that you can add or remove classes...
 -1 5 7 8 9 10 11 12 13 Below are the times (in days) it takes for a sample of 16 customers from Sarah's computer store to pay their invoices. 19,15,43, 39, 35, 31, 27, 22, 34, 34, 34, 30, 30, 30, 26, 26 Draw the frequency polygon for these data using an initial class boundary of 14.5 and a class width of 7. Note that you can add or remove classes from the figure. Label each class with...
 P4xcvcZN2HQDRJQiWdax1PZm2.. O STATISTICS Histograms for grouped data Here are the shopping times in minutes) for a sample of 22 shoppers at a particular grocery store: 26, 23, 44, 41, 38, 35, 31, 28, 25, 22, 43, 40, 21, 21, 21, 43, 43, 43, 39, 39, 36, 36 Draw the histogram for these data using an initial class boundary of 20.5 and a class width of 5. Note that you can add or remove classes from the figure. Label each class...
 - 5 8 9 - 10 - 11 12 - 13 14 15 16 Below are the times (in days) it takes for a sample of 16 customers from Sarah's computer store to pay their invoices. 19,15,43, 39, 35, 31, 27, 22, 34, 34, 34, 30, 30, 30, 26, 26 Draw the frequency polygon for these data using an initial class boundary of 14.5 and a class width of 7. Note that you can add or remove classes from the...
 Here are the shopping times in minutes) for a sample of 22 shoppers at a particular computer store: 26, 23, 44, 41, 38, 35, 31, 28, 25, 22, 43, 40, 21, 21, 43, 43, 43, 39, 39, 39, 36, 36 Draw the frequency polygon for these data using an initial class boundary of 20.5 and a class width of 5. Note that you can add or remove classes from the figure. Label each class with its midpoint. Frequency I:lolo:1 8...
 The following are the lengths of stay in days) for a random sample of 16 patients discharged from a particular hospital: 11.9.3, 11.6 3.9.9.9.5.5. 12. 12. 12.9.9 Draw the histogram for these data using an initial class boundary of 2.5 and a class width of 2. Note that you can add or remove classes from the figure. Label each dass with its endpoints Frequency 0:0 (0:0
Most questions answered within 3 hours.
-
A compression ignition engine is being analyzed. The
residual gas fraction is xr=0.02. The fuel-to-air
equivalence ratio is...
asked 4 minutes ago -
Which of the following is FALSE about Slow Twitch Fibers (Slow
fibers, slow oxidative fibers) compared...
asked 8 minutes ago -
Need help with drawing the mechanism of succinic anhydride to
succinimide via ammonia and heat. Kind...
asked 28 minutes ago -
Steve is a sales rep for Clearwater Purification Systems, a
national manufacturer of residential water treatment...
asked 12 minutes ago -
Question 4. Using your knowledge of IS-LM, solve the following:
8
12
1+r 1+r
(a) If...
asked 17 minutes ago -
Paige's Properties Inc. reported 2018 net income of $2.90
million and depreciation of $269,000. Paige's Properties,...
asked 27 minutes ago -
Using loops, write a C# program that asks the user to
enter repeatedly an integer number,...
asked 32 minutes ago -
A researcher conducts an experiment comparing three treatment
conditions. The data consist of n = 34...
asked 50 minutes ago -
A generating station is producing 1.8 x 10⁶ W of power that is
to be sent...
asked 42 minutes ago -
Consider the reaction Mg(s)+Fe2+(aq)→Mg2+(aq)+Fe(s) at 49 ∘C ,
where [Fe2+]= 3.30 M and [Mg2+]= 0.210 M...
asked 42 minutes ago -
Of men aged 65 and over 20.5% are still in the US labor force. A
random...
asked 59 minutes ago -
A bag contains 80 balls numbered 1, . . . , 80. Before the game
starts,...
asked 1 hour ago