


Homework Answers
Solution to question
10 and question 11:
In the graph given, as line S shifts from its initial position of S0 to its final position at S1;the intersection with line D shifts from point A to point B and quantity decreases (as depicted by black arrow) and the price increases (as depicted by green arrow).
Solution to question 12:
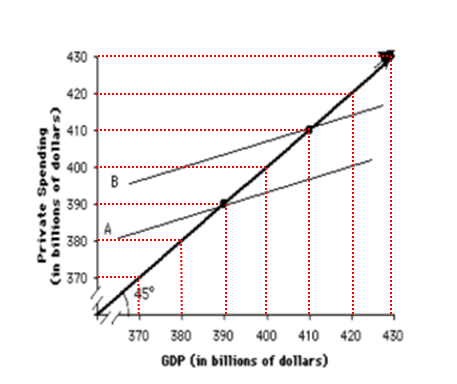
Along the 45 degree line the value along X – axis equals the values along the Y- axis. So in this case, GDP equals private spending at all points along the 45 degree line as can be seen through dotted red lines.
So the answer is option C.
Add Answer to:
QUESTION 10 5 points Save A In the graph below, line S shifts from its initial...
QUESTION 13 5 point Two lines, A and B, intersect a 45 degree line on the...
 QUESTION 13 5 point Two lines, A and B, intersect a 45 degree line on the Private Spending versus GDP graph below. At which GDP value (in billions) does line B intersect the 45 degree line? 430 420 410 400 390 E 380 5 370 45 370 380 390 400 410 420 430 GDP (in billions of dollars) 390 400 410 420 QUESTION 14 5 points The slope of a line refers to the place where the line intersects the...
10. The shifter tool Another manipulable graph object The shifter tool is designed to let you...
 10. The shifter tool Another manipulable graph object The shifter tool is designed to let you answer questions by shifting entire lines or points along a line (or both) from one position to another. You can select any part of the line and drag it to the left or to the right. Once you have moved the point or line far enough, it will snap into one of a few possible positions. Shift the blue demand line (labeled D) to...
Working with lines As with individual points, the control points that define a line can be...
 Working with lines As with individual points, the control points that define a line can be placed only on the snap points of the graph. Often (though not always), snap points coincide with the intersection of grid lines. You are graded on the position of the line itself, not the position of the control points along the line. On the following graph, place the green line (triangle symbol) directly on top of the upward-sioping line you are given. Hint: Make...
need help on this graph Physies 195 - Straight-line kinematics Data: Dot period=1/10s: the time interval...
 need help on this graph
Physies 195 - Straight-line kinematics Data: Dot period=1/10s: the time interval between dots is 0.100 corrected values] 15 16 Xc (cm) te(s) 6 7 0 12 3 14. X(cm) t(s) đa (cm) | V (cm/s) 0 0 2.18 0.1002 .182 .0 4.890.200 12.7127.00 2. 5 0.30 3.67 36.70 12.88 o.quo 4.32 430 f 9.95 O S 10 .20 zich were 1 1 tbalo 30,56 38.0 74.50 46.43 0.900 8.8 84.43 55-25 88.00 1101.30 65.39 1.100...
need help on this graph
Physies 195 - Straight-line kinematics Data: Dot period=1/10s: the time interval between dots is 0.100 corrected values] 15 16 Xc (cm) te(s) 6 7 0 12 3 14. X(cm) t(s) đa (cm) | V (cm/s) 0 0 2.18 0.1002 .182 .0 4.890.200 12.7127.00 2. 5 0.30 3.67 36.70 12.88 o.quo 4.32 430 f 9.95 O S 10 .20 zich were 1 1 tbalo 30,56 38.0 74.50 46.43 0.900 8.8 84.43 55-25 88.00 1101.30 65.39 1.100...
The following graph shows the domestic demand and domestic supply curves for tangerines in Panama. Suppose...
 The following graph shows the domestic demand and domestic supply curves for tangerines in Panama. Suppose Panama's government currently does not allow international trade in tangerines. Use the black point (plus symbol) to indicate the equilibrium price of a ton of tangerines and the equilibrium quantity of tangerines in Panama in the absence of international trade. Then, use the green triangle (triangle symbol) to shade the area representing consumer surplus in equilibrium. Finally, use the purple triangle (diamond symbol) to...
Please box answers! Thank you. 11. Monetary policy and the LM curve Aa Aa The following graph shows the demand and supply of real money balances in a hypothetical economy. Use the black point (X point...
 Please box answers! Thank
you.
11. Monetary policy and the LM curve Aa Aa The following graph shows the demand and supply of real money balances in a hypothetical economy. Use the black point (X point) to indicate the equilibrium in this market. Dashed drop lines will automatically extend to both axes. REAL INTEREST RATE [Percent) 10 Equilibrium Supply New Supply New Equilibrium Demand 3 0 10 20 30 40 50 60 70 80 90 100 REAL MONEY BALANCES Help...
Please box answers! Thank
you.
11. Monetary policy and the LM curve Aa Aa The following graph shows the demand and supply of real money balances in a hypothetical economy. Use the black point (X point) to indicate the equilibrium in this market. Dashed drop lines will automatically extend to both axes. REAL INTEREST RATE [Percent) 10 Equilibrium Supply New Supply New Equilibrium Demand 3 0 10 20 30 40 50 60 70 80 90 100 REAL MONEY BALANCES Help...
Question 6: What percentage error would result from miscounting the bars by one? EXPERIMENT 10 THIN...
 Question 6:
What percentage error would result from miscounting
the bars by one?
EXPERIMENT 10 THIN FILM INTERFERENCE Light from a monochromatic source is shined downward on two glass plates that are separated at one end by a hair. Light that is reflected from the top and bottom surfaces of the wedge-shaped thin film of air undergoes interference, and a series of dark and light lines are seen. By counting the number of dark or light lines over a known...
Question 6:
What percentage error would result from miscounting
the bars by one?
EXPERIMENT 10 THIN FILM INTERFERENCE Light from a monochromatic source is shined downward on two glass plates that are separated at one end by a hair. Light that is reflected from the top and bottom surfaces of the wedge-shaped thin film of air undergoes interference, and a series of dark and light lines are seen. By counting the number of dark or light lines over a known...
Question 5: How would dust and oil on the glass plates affect the results? EXPERIMENT 10 THIN FILM I...
 Question 5:
How would dust and oil on the glass plates affect the
results?
EXPERIMENT 10 THIN FILM INTERFERENCE Light from a monochromatic source is shined downward on two glass plates that are separated at one end by a hair. Light that is reflected from the top and bottom surfaces of the wedge-shaped thin film of air undergoes interference, and a series of dark and light lines are seen. By counting the number of dark or light lines over a...
Question 5:
How would dust and oil on the glass plates affect the
results?
EXPERIMENT 10 THIN FILM INTERFERENCE Light from a monochromatic source is shined downward on two glass plates that are separated at one end by a hair. Light that is reflected from the top and bottom surfaces of the wedge-shaped thin film of air undergoes interference, and a series of dark and light lines are seen. By counting the number of dark or light lines over a...
I need to graph point C (from question 2) and to answer 2a, is it stable...
 I
need to graph point C (from question 2) and to answer 2a, is it
stable or unstable. thank you
LORESTACI EXERCISE 17 PROBLEMS-PART II (English Units) On the following chart, use the sets of hypothetical data to plot the vertical tempera- ture profile (the environmental lapse rate) of the atmosphere in two locations. Using a straightedge, connect the temperature points for Location A with blue line, and for Loca- tion B with a green line (if you do not...
I
need to graph point C (from question 2) and to answer 2a, is it
stable or unstable. thank you
LORESTACI EXERCISE 17 PROBLEMS-PART II (English Units) On the following chart, use the sets of hypothetical data to plot the vertical tempera- ture profile (the environmental lapse rate) of the atmosphere in two locations. Using a straightedge, connect the temperature points for Location A with blue line, and for Loca- tion B with a green line (if you do not...
its mcq and short question answer. 19) If the Consumer Price Index chenges from 120 in...
 its mcq and short question answer.
19) If the Consumer Price Index chenges from 120 in year ene to 150 in yeae twe, the rae of inflation in the intervening yenr is A) 10 percent B) 12.5 percet 9 20 percent D) 25 percent E) 30 percent HORT ANSWER. Write the word or phrase that best completes each statement or answers the question. 20 20) The Consumer Price Index tends to the true problem of inflation 28) Suppone that the...
its mcq and short question answer.
19) If the Consumer Price Index chenges from 120 in year ene to 150 in yeae twe, the rae of inflation in the intervening yenr is A) 10 percent B) 12.5 percet 9 20 percent D) 25 percent E) 30 percent HORT ANSWER. Write the word or phrase that best completes each statement or answers the question. 20 20) The Consumer Price Index tends to the true problem of inflation 28) Suppone that the...
 QUESTION 13 5 point Two lines, A and B, intersect a 45 degree line on the Private Spending versus GDP graph below. At which GDP value (in billions) does line B intersect the 45 degree line? 430 420 410 400 390 E 380 5 370 45 370 380 390 400 410 420 430 GDP (in billions of dollars) 390 400 410 420 QUESTION 14 5 points The slope of a line refers to the place where the line intersects the...
 10. The shifter tool Another manipulable graph object The shifter tool is designed to let you answer questions by shifting entire lines or points along a line (or both) from one position to another. You can select any part of the line and drag it to the left or to the right. Once you have moved the point or line far enough, it will snap into one of a few possible positions. Shift the blue demand line (labeled D) to...
 Working with lines As with individual points, the control points that define a line can be placed only on the snap points of the graph. Often (though not always), snap points coincide with the intersection of grid lines. You are graded on the position of the line itself, not the position of the control points along the line. On the following graph, place the green line (triangle symbol) directly on top of the upward-sioping line you are given. Hint: Make...
 need help on this graph
Physies 195 - Straight-line kinematics Data: Dot period=1/10s: the time interval between dots is 0.100 corrected values] 15 16 Xc (cm) te(s) 6 7 0 12 3 14. X(cm) t(s) đa (cm) | V (cm/s) 0 0 2.18 0.1002 .182 .0 4.890.200 12.7127.00 2. 5 0.30 3.67 36.70 12.88 o.quo 4.32 430 f 9.95 O S 10 .20 zich were 1 1 tbalo 30,56 38.0 74.50 46.43 0.900 8.8 84.43 55-25 88.00 1101.30 65.39 1.100...
need help on this graph
Physies 195 - Straight-line kinematics Data: Dot period=1/10s: the time interval between dots is 0.100 corrected values] 15 16 Xc (cm) te(s) 6 7 0 12 3 14. X(cm) t(s) đa (cm) | V (cm/s) 0 0 2.18 0.1002 .182 .0 4.890.200 12.7127.00 2. 5 0.30 3.67 36.70 12.88 o.quo 4.32 430 f 9.95 O S 10 .20 zich were 1 1 tbalo 30,56 38.0 74.50 46.43 0.900 8.8 84.43 55-25 88.00 1101.30 65.39 1.100...
 The following graph shows the domestic demand and domestic supply curves for tangerines in Panama. Suppose Panama's government currently does not allow international trade in tangerines. Use the black point (plus symbol) to indicate the equilibrium price of a ton of tangerines and the equilibrium quantity of tangerines in Panama in the absence of international trade. Then, use the green triangle (triangle symbol) to shade the area representing consumer surplus in equilibrium. Finally, use the purple triangle (diamond symbol) to...
 Please box answers! Thank
you.
11. Monetary policy and the LM curve Aa Aa The following graph shows the demand and supply of real money balances in a hypothetical economy. Use the black point (X point) to indicate the equilibrium in this market. Dashed drop lines will automatically extend to both axes. REAL INTEREST RATE [Percent) 10 Equilibrium Supply New Supply New Equilibrium Demand 3 0 10 20 30 40 50 60 70 80 90 100 REAL MONEY BALANCES Help...
Please box answers! Thank
you.
11. Monetary policy and the LM curve Aa Aa The following graph shows the demand and supply of real money balances in a hypothetical economy. Use the black point (X point) to indicate the equilibrium in this market. Dashed drop lines will automatically extend to both axes. REAL INTEREST RATE [Percent) 10 Equilibrium Supply New Supply New Equilibrium Demand 3 0 10 20 30 40 50 60 70 80 90 100 REAL MONEY BALANCES Help...
 Question 6:
What percentage error would result from miscounting
the bars by one?
EXPERIMENT 10 THIN FILM INTERFERENCE Light from a monochromatic source is shined downward on two glass plates that are separated at one end by a hair. Light that is reflected from the top and bottom surfaces of the wedge-shaped thin film of air undergoes interference, and a series of dark and light lines are seen. By counting the number of dark or light lines over a known...
Question 6:
What percentage error would result from miscounting
the bars by one?
EXPERIMENT 10 THIN FILM INTERFERENCE Light from a monochromatic source is shined downward on two glass plates that are separated at one end by a hair. Light that is reflected from the top and bottom surfaces of the wedge-shaped thin film of air undergoes interference, and a series of dark and light lines are seen. By counting the number of dark or light lines over a known...
 Question 5:
How would dust and oil on the glass plates affect the
results?
EXPERIMENT 10 THIN FILM INTERFERENCE Light from a monochromatic source is shined downward on two glass plates that are separated at one end by a hair. Light that is reflected from the top and bottom surfaces of the wedge-shaped thin film of air undergoes interference, and a series of dark and light lines are seen. By counting the number of dark or light lines over a...
Question 5:
How would dust and oil on the glass plates affect the
results?
EXPERIMENT 10 THIN FILM INTERFERENCE Light from a monochromatic source is shined downward on two glass plates that are separated at one end by a hair. Light that is reflected from the top and bottom surfaces of the wedge-shaped thin film of air undergoes interference, and a series of dark and light lines are seen. By counting the number of dark or light lines over a...
 I
need to graph point C (from question 2) and to answer 2a, is it
stable or unstable. thank you
LORESTACI EXERCISE 17 PROBLEMS-PART II (English Units) On the following chart, use the sets of hypothetical data to plot the vertical tempera- ture profile (the environmental lapse rate) of the atmosphere in two locations. Using a straightedge, connect the temperature points for Location A with blue line, and for Loca- tion B with a green line (if you do not...
I
need to graph point C (from question 2) and to answer 2a, is it
stable or unstable. thank you
LORESTACI EXERCISE 17 PROBLEMS-PART II (English Units) On the following chart, use the sets of hypothetical data to plot the vertical tempera- ture profile (the environmental lapse rate) of the atmosphere in two locations. Using a straightedge, connect the temperature points for Location A with blue line, and for Loca- tion B with a green line (if you do not...
 its mcq and short question answer.
19) If the Consumer Price Index chenges from 120 in year ene to 150 in yeae twe, the rae of inflation in the intervening yenr is A) 10 percent B) 12.5 percet 9 20 percent D) 25 percent E) 30 percent HORT ANSWER. Write the word or phrase that best completes each statement or answers the question. 20 20) The Consumer Price Index tends to the true problem of inflation 28) Suppone that the...
its mcq and short question answer.
19) If the Consumer Price Index chenges from 120 in year ene to 150 in yeae twe, the rae of inflation in the intervening yenr is A) 10 percent B) 12.5 percet 9 20 percent D) 25 percent E) 30 percent HORT ANSWER. Write the word or phrase that best completes each statement or answers the question. 20 20) The Consumer Price Index tends to the true problem of inflation 28) Suppone that the...
Most questions answered within 3 hours.
-
A 8.15- g bullet from a 9-mm pistol has a velocity of 366.0 m/s.
It strikes...
asked 1 hour ago -
The outstanding bonds of Alpha Extracts have a yield to maturity
of 7.4 percent and a...
asked 1 hour ago -
The Problem: The Case of the Harmonizing Vacations
Your CEO is exploring partnering with a European...
asked 2 hours ago -
A chemical equation is balanced by adding coefficients in front
of some formulas so that the...
asked 2 hours ago -
From the literature (reference your sources): What are the
lattice parameters of calcite and aragonite? Why...
asked 3 hours ago -
Your system is rejecting the question am asking which is
preceded by a case study. It...
asked 3 hours ago -
3. On January 2, 2000, Larry creates a trust with himself as
trustee. Larry as trustee...
asked 3 hours ago -
A member of the volleyball team spikes the ball. During this
process, she changes the velocity...
asked 3 hours ago -
Are adult gamers less likely to use a gaming console (Xbox,
PlayStation, Wii, etc...) than teen...
asked 4 hours ago -
The University of
Texas recently reported that 43% of college students aged 18-24
would spend their...
asked 4 hours ago -
The length of stay at a specific emergency department in
Phoenix, Arizona, in 2009 had a...
asked 3 hours ago -
. Please give the mechanism for this type of problem. Step by
Step
The toxin that...
asked 3 hours ago