

PS. Remember to ad the tables and graphics
Homework Answers
In the diagram below, we have shown downward sloping demand
curve and upward sloping supply curve. Market equilibrium is
attained at the point where demand curve intersects supply curve,
i.e, equilibrium price is P* and equilibrium quantity is
Q*.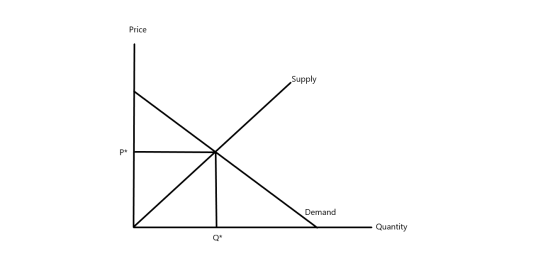
1) If tastes and preferences for a product gets reduced this season, demand curve shifts to its left. As a result, equilibrium price rises whereas, equilibrium quantity falls.
2) For a particular good, if 75 producers enters the market, supply curve of the product shifts to the right. As a result, equilibrium price will fall but equilibrium quantity must rise.
3) If consumer expectations are negatively affected about future use of a product, its demand curve will shift to the left. As a result, equilibrium price rises whereas, equilibrium quantity falls.
4) With progress in technology, production and efficiency of a product increases. As a result, supply curve shifts to the right. This will cause equilibrium price to fall but equilibrium quantity must rise.
Add Answer to:
PS. Remember to ad the tables and graphics
Market balance In this activity you must apply...
Identify in each of the situations who is affected (demand / supply) and how it affects...
Identify in each of the situations who is affected (demand / supply) and how it affects (increases / decreases) : We have Identified in each of the situations who is affected (demand / supply) and how it affects (increases / decreases) : please illustrate in a graph how each situations are effected. So we are able to see it's visually the outcome. 3) FOR THE DISTRIBUTION OF A NEW GAS DRINK, 35 NEW PRODUCERS HAVE ENTERED THE MARKET. Offer Increase...
at a Drag the words into the correct boxes Market occurs when all Net have been...
 at a Drag the words into the correct boxes Market occurs when all Net have been captured. This means Demand will Supply equal and Marginal will equal Costs. This also occurs efficiency when there is no Loss before Net Benefits are all captured when the sum of Consumer and Surplus is greater maximised and there is no under or production or produces Price ceilings set equilibrium are said to be binding. This is because the market results in a where...
Drag the words into the correct boxes Market occurs when all Net have been captured. This...
 Drag the words into the correct boxes Market occurs when all Net have been captured. This means Demand will equal and Marginal will equal Costs. This also occurs when there is no Loss. Net Benefits are all captured when the sum of Consumer and Surplus is maximised and there is no under or production or Price ceilings set equilibrium are said to be binding. This is because the market results in a where quantity demanded is than quantity supplied Price...
Consider the market for pens. Suppose that increased medicalconcerns over lead pencils have led schools...
 Consider the market for pens. Suppose that increased medical
concerns over lead pencils have led schools to steer away from
pencil use in favor of pens. Moreover, the price of ink, an
important input in pen production, has increased considerably.On the following graph, labeled Scenario 1, indicate the effect
these two events have on the demand for and supply of pensNext, complete the following graph, labeled Scenario 2, by
shifting the supply and demand curves in the same way that...
Consider the market for pens. Suppose that increased medical
concerns over lead pencils have led schools to steer away from
pencil use in favor of pens. Moreover, the price of ink, an
important input in pen production, has increased considerably.On the following graph, labeled Scenario 1, indicate the effect
these two events have on the demand for and supply of pensNext, complete the following graph, labeled Scenario 2, by
shifting the supply and demand curves in the same way that...
ONLY QUESTION 5 AND 6 1. The demand and supply schedules for pop in Vancouver are...
ONLY QUESTION 5 AND 6 1. The demand and supply schedules for pop in Vancouver are as follows: Price ($/pack of 2 bottles) Quantity demanded (thousands /week) Quantity supplied (thousands/ week) 2 280 0 3 240 30 4 200 60 5 160 90 6 120 120 7 80 140 8 40 160 9 0 180 (ONLY QUESTION 5 AND6) 1) With the use of a demand and supply diagram, show the market equilibrium. b. Now suppose that a fire destroys...
Consider the market for pens. Suppose that increased medical concerns over lead pencils have led schools to steer away from pencil use in favor of pens. Moreover, the price of plastic, an important input in pen production, has increased considerably.
 13. How shifts in demand and supply affect
equilibriumConsider the market for pens. Suppose that increased medical
concerns over lead pencils have led schools to steer away from
pencil use in favor of pens. Moreover, the price of plastic, an
important input in pen production, has increased considerably.On the following graph, labeled Scenario 1, indicate the effect
these two events have on the demand for and supply of pens.Note: Select and drag one or both of the curves to the...
13. How shifts in demand and supply affect
equilibriumConsider the market for pens. Suppose that increased medical
concerns over lead pencils have led schools to steer away from
pencil use in favor of pens. Moreover, the price of plastic, an
important input in pen production, has increased considerably.On the following graph, labeled Scenario 1, indicate the effect
these two events have on the demand for and supply of pens.Note: Select and drag one or both of the curves to the...
5 2. (15) Social Surplus Analysis The table below describes a market with two consumers and...
 5 2. (15) Social Surplus Analysis The table below describes a market with two consumers and two producers. It gives each consumer's demand curve and each producer's supply curve for integer quantities of the good. The demand and supply curves are all linear. Let p denote price, and q quantity Cons I D Cons 2 D Agg D Firm 1 S 10 Firm 2 S Agg S S5 12.5 10 7.5 $4 S3 S2 SI SO 2.5 a) (3) Fill...
2. (15) Social Surplus Analysis The table below describes a market with two consumers and two...
 2. (15) Social Surplus Analysis The table below describes a market with two consumers and two producers. It gives each consumer's demand curve and each producer's supply curve for integer quantities of the good. The demand and supply curves are all linear. Let p denote price, and q quantity Price S5 Firm 1SFirm2S_Agg S 10 Cons 1 D Cons 2 D Agg D 12.5 10 7.5 4 S3 S2 S1 4 4 4 2.5 10 a) (3) Fill in the...
Consider the market for pens. Suppose that a new educational study has proven that the practice...
 Consider the market for pens. Suppose that a new educational study has proven that the practice of writing, erasing, and rewriting improves students' ability to process information, leading parents to steer away from pen use in favor of pencils. Moreover, the price of plastic, an important input in pen production, has increased considerably.On the following graph, labeled Scenario 1, indicate the effect these two events have on the demand for and supoly of pens.Note: Select and drag one or both...
4. How shifts in demand and supply affect equilibrium Consider the market for pens. Suppose that...
 4. How shifts in demand and supply affect equilibriumConsider the market for pens. Suppose that the number of students with an allergy to pencil erasers increases, causing more students to switch from pencils to pens in school. Moreover, the price of ink, an important input in pen production, has increased considerably.On the following graph, labeled Scenario 1, indicate the effect these two events have on the demand for and supply of pens.Note: Select and drag one or both of the...
 at a Drag the words into the correct boxes Market occurs when all Net have been captured. This means Demand will Supply equal and Marginal will equal Costs. This also occurs efficiency when there is no Loss before Net Benefits are all captured when the sum of Consumer and Surplus is greater maximised and there is no under or production or produces Price ceilings set equilibrium are said to be binding. This is because the market results in a where...
 Drag the words into the correct boxes Market occurs when all Net have been captured. This means Demand will equal and Marginal will equal Costs. This also occurs when there is no Loss. Net Benefits are all captured when the sum of Consumer and Surplus is maximised and there is no under or production or Price ceilings set equilibrium are said to be binding. This is because the market results in a where quantity demanded is than quantity supplied Price...
 Consider the market for pens. Suppose that increased medical
concerns over lead pencils have led schools to steer away from
pencil use in favor of pens. Moreover, the price of ink, an
important input in pen production, has increased considerably.On the following graph, labeled Scenario 1, indicate the effect
these two events have on the demand for and supply of pensNext, complete the following graph, labeled Scenario 2, by
shifting the supply and demand curves in the same way that...
Consider the market for pens. Suppose that increased medical
concerns over lead pencils have led schools to steer away from
pencil use in favor of pens. Moreover, the price of ink, an
important input in pen production, has increased considerably.On the following graph, labeled Scenario 1, indicate the effect
these two events have on the demand for and supply of pensNext, complete the following graph, labeled Scenario 2, by
shifting the supply and demand curves in the same way that...
 13. How shifts in demand and supply affect
equilibriumConsider the market for pens. Suppose that increased medical
concerns over lead pencils have led schools to steer away from
pencil use in favor of pens. Moreover, the price of plastic, an
important input in pen production, has increased considerably.On the following graph, labeled Scenario 1, indicate the effect
these two events have on the demand for and supply of pens.Note: Select and drag one or both of the curves to the...
13. How shifts in demand and supply affect
equilibriumConsider the market for pens. Suppose that increased medical
concerns over lead pencils have led schools to steer away from
pencil use in favor of pens. Moreover, the price of plastic, an
important input in pen production, has increased considerably.On the following graph, labeled Scenario 1, indicate the effect
these two events have on the demand for and supply of pens.Note: Select and drag one or both of the curves to the...
 5 2. (15) Social Surplus Analysis The table below describes a market with two consumers and two producers. It gives each consumer's demand curve and each producer's supply curve for integer quantities of the good. The demand and supply curves are all linear. Let p denote price, and q quantity Cons I D Cons 2 D Agg D Firm 1 S 10 Firm 2 S Agg S S5 12.5 10 7.5 $4 S3 S2 SI SO 2.5 a) (3) Fill...
 2. (15) Social Surplus Analysis The table below describes a market with two consumers and two producers. It gives each consumer's demand curve and each producer's supply curve for integer quantities of the good. The demand and supply curves are all linear. Let p denote price, and q quantity Price S5 Firm 1SFirm2S_Agg S 10 Cons 1 D Cons 2 D Agg D 12.5 10 7.5 4 S3 S2 S1 4 4 4 2.5 10 a) (3) Fill in the...
Most questions answered within 3 hours.
-
NO3- nitrate ion, what is the symmetry operationof rotation of
it?
asked 3 minutes ago -
Block A, with mass mA, is initially at rest on a frictionless
horizontal floor. Block B,...
asked 5 minutes ago -
Space shuttle astronauts each consume an average of 3000
calories per day. One meal normally consists...
asked 6 minutes ago -
A distribution center for a sporting goods retailer places
orders with manufacturers for a variety of...
asked 22 minutes ago -
Suppose you have a bag of Skittles with 27 blue Skittles, 18
green
Skittles, 32 red...
asked 24 minutes ago -
Sketch the circuit diagram for an inverting amplifier, and give
component values that will produce a...
asked 27 minutes ago -
Develop in C language the function whose prototype is described
below. Please, send the entire code,...
asked 45 minutes ago -
What single payment today would replace a payment stream of
$50,000 that will be paid today,...
asked 39 minutes ago -
please c++ with functions *Modify the Guessing Game Write the
secret number to a file. Then...
asked 39 minutes ago -
Question about ACID/BASE. Equal volumes of 0.230 M weak base (Kb
= 4.0× 10⁻⁹) and 0.230...
asked 44 minutes ago -
The charges and coordinates of two charged particles held fixed
in an xy plane are q1...
asked 46 minutes ago -
A particle of mass M = 7.5 kg is at a position r = (-3 i...
asked 46 minutes ago