Twenty metrics of liquidity, Solvency, and Profitability The comparative financial statements of Automotive Solutions Inc. are...
Twenty metrics of liquidity, Solvency, and Profitability
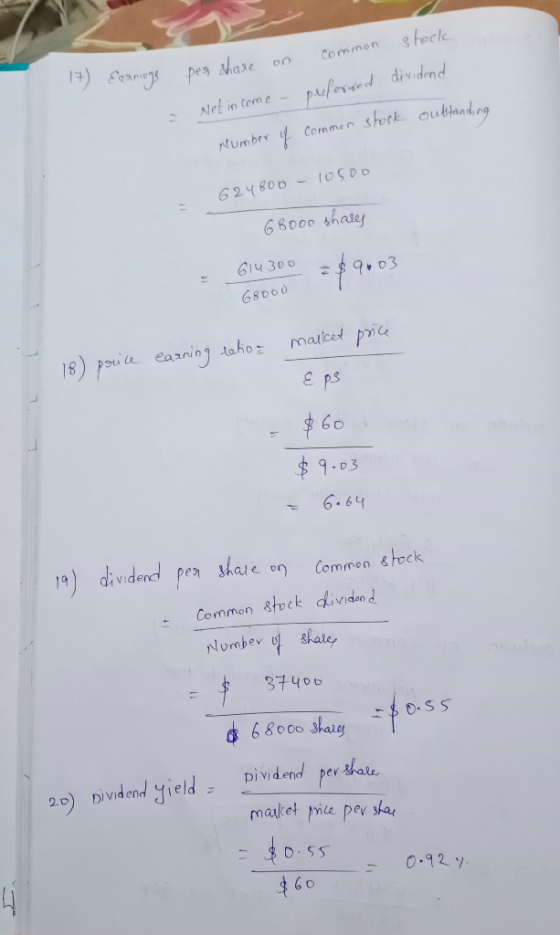
The comparative financial statements of Automotive Solutions Inc. are as follows. The market price of Automotive Solutions Inc. common stock was $60 on December 31, 20Y8.
| AUTOMOTIVE SOLUTIONS INC. Comparative Income Statement For the Years Ended December 31, 20Y8 and 20Y7 |
||||
| 20Y8 | 20Y7 | |||
| Sales | $4,091,650 | $3,769,800 | ||
| Cost of goods sold | (1,470,950) | (1,353,270) | ||
| Gross profit | $2,620,700 | $2,416,530 | ||
| Selling expenses | $(919,620) | $(1,109,770) | ||
| Administrative expenses | (783,380) | (651,770) | ||
| Total operating expenses | (1,703,000) | (1,761,540) | ||
| Operating income | $917,700 | $654,990 | ||
| Other revenue and expense: | ||||
| Other income | 48,300 | 41,810 | ||
| Other expense (interest) | (256,000) | (140,800) | ||
| Income before income tax | $710,000 | $556,000 | ||
| Income tax expense | (85,200) | (66,500) | ||
| Net income | $624,800 | $489,500 | ||
| AUTOMOTIVE SOLUTIONS INC. Comparative Statement of Stockholders’ Equity For the Years Ended December 31, 20Y8 and 20Y7 |
||||||||||||||||||
| 20Y8 | 20Y7 | |||||||||||||||||
| Preferred Stock |
Common Stock |
Retained Earnings |
Preferred Stock |
Common Stock |
Retained Earnings |
|||||||||||||
| Balances, Jan. 1 | $600,000 | $680,000 | $2,831,550 | $600,000 | $680,000 | $2,389,950 | ||||||||||||
| Net income | 624,800 | 489,500 | ||||||||||||||||
| Dividends: | ||||||||||||||||||
| Preferred stock | (10,500) | (10,500) | ||||||||||||||||
| Common stock | (37,400) | (37,400) | ||||||||||||||||
| Balances, Dec. 31 | $600,000 | $680,000 | $3,408,450 | $600,000 | $680,000 | $2,831,550 | ||||||||||||
| AUTOMOTIVE SOLUTIONS INC. Comparative Balance Sheet December 31, 20Y8 and 20Y7 |
|||||
| Dec. 31, 20Y8 | Dec. 31, 20Y7 | ||||
| Assets | |||||
| Current assets: | |||||
| Cash | $742,640 | $620,940 | |||
| Temporary investments | 1,124,000 | 1,028,980 | |||
| Accounts receivable (net) | 715,400 | 671,600 | |||
| Inventories | 540,200 | 408,800 | |||
| Prepaid expenses | 140,496 | 124,190 | |||
| Total current assets | $3,262,736 | $2,854,510 | |||
| Long-term investments | 2,125,319 | 939,705 | |||
| Property, plant, and equipment (net) | 3,520,000 | 3,168,000 | |||
| Total assets | $8,908,055 | $6,962,215 | |||
| Liabilities | |||||
| Current liabilities | $1,019,605 | $1,090,665 | |||
| Long-term liabilities: | |||||
| Mortgage note payable, 8%, due in 15 years | $1,440,000 | $0 | |||
| Bonds payable, 8%, due in 20 years | 1,760,000 | 1,760,000 | |||
| Total long-term liabilities | $3,200,000 | $1,760,000 | |||
| Total liabilities | $4,219,605 | $2,850,665 | |||
| Stockholders' Equity | |||||
| Preferred $0.70 stock, $40 par | $600,000 | $600,000 | |||
| Common stock, $10 par | 680,000 | 680,000 | |||
| Retained earnings | 3,408,450 | 2,831,550 | |||
| Total stockholders' equity | $4,688,450 | $4,111,550 | |||
| Total liabilities and stockholders' equity | $8,908,055 | $6,962,215 | |||
Instructions:
Determine the following measures for 20Y8. Round ratio values to one decimal place and dollar amounts to the nearest cent. For number of days' sales in receivables and number of days' sales in inventory, round intermediate calculations to the nearest whole dollar and final amounts to one decimal place. Assume there are 365 days in the year.
| 1. Working capital | $ | |
| 2. Current ratio | ||
| 3. Quick ratio | ||
| 4. Accounts receivable turnover | ||
| 5. Days' sales in receivables | days | |
| 6. Inventory turnover | ||
| 7. Days' sales in inventory | days | |
| 8. Debt ratio | % | |
| 9. Ratio of liabilities to stockholders' equity | ||
| 10. Ratio of fixed assets to long-term liabilities | ||
| 11. Times interest earned | times | |
| 12. Times preferred dividends earned | times | |
| 13. Asset turnover | ||
| 14. Return on total assets | % | |
| 15. Return on stockholders’ equity | % | |
| 16. Return on common stockholders’ equity | % | |
| 17. Earnings per share on common stock | $ | |
| 18. Price-earnings ratio | ||
| 19. Dividends per share of common stock | $ | |
| 20. Dividend yield | % |
Homework Answers


Add Answer to:
Twenty metrics of liquidity, Solvency, and Profitability
The comparative financial statements of Automotive Solutions
Inc. are...
Twenty metrics of liquidity, Solvency, and Profitability The comparative financial statements of Automotive Solutions Inc. are...
Twenty metrics of liquidity, Solvency, and Profitability The comparative financial statements of Automotive Solutions Inc. are as follows. The market price of Automotive Solutions Inc. common stock was $66 on December 31, 20Y8. AUTOMOTIVE SOLUTIONS INC. Comparative Income Statement For the Years Ended December 31, 20Y8 and 20Y7 20Y8 20Y7 Sales $5,409,300 $4,983,820 Cost of goods sold (2,124,300) (1,954,360) Gross profit $3,285,000 $3,029,460 Selling expenses $(1,001,580) $(1,264,600) Administrative expenses (853,200) (742,700) Total operating expenses (1,854,780) (2,007,300) Operating income $1,430,220 $1,022,160...
Twenty metrics of liquidity, Solvency, and Profitability The comparative financial statements of Automotive Solutions Inc. are...
Twenty metrics of liquidity, Solvency, and Profitability The comparative financial statements of Automotive Solutions Inc. are as follows. The market price of Automotive Solutions Inc. common stock was $53 on December 31, 20Y8. AUTOMOTIVE SOLUTIONS INC. Comparative Income Statement For the Years Ended December 31, 20Y8 and 20Y7 20Y8 20Y7 Sales $1,248,300 $1,150,140 Cost of goods sold (429,240) (394,900) Gross profit $819,060 $755,240 Selling expenses $(285,370) $(345,520) Administrative expenses (243,090) (202,920) Total operating expenses (528,460) (548,440) Operating income $290,600 $206,800...
Twenty metrics of liquidity, Solvency, and Profitability The comparative financial statements of Automotive Solutions Inc. are...
Twenty metrics of liquidity, Solvency, and Profitability The comparative financial statements of Automotive Solutions Inc. are as follows. The market price of Automotive Solutions Inc. common stock was $59 on December 31, 20Y8. AUTOMOTIVE SOLUTIONS INC. Comparative Income Statement For the Years Ended December 31, 20Y8 and 20Y7 20Y8 20Y7 Sales $6,137,475 $5,654,750 Cost of goods sold (2,124,300) (1,954,360) Gross profit $4,013,175 $3,700,390 Selling expenses $(1,438,910) $(1,738,690) Administrative expenses (1,225,745) (1,021,140) Total operating expenses (2,664,655) (2,759,830) Operating income $1,348,520 $940,560...
Twenty metrics of liquidity, Solvency, and Profitability The comparative financial statements of Automotive Solutions Inc. are...
Twenty metrics of liquidity, Solvency, and Profitability The comparative financial statements of Automotive Solutions Inc. are as follows. The market price of Automotive Solutions Inc. common stock was $64 on December 31, 20Y8. AUTOMOTIVE SOLUTIONS INC. Comparative Income Statement For the Years Ended December 31, 20Y8 and 20Y7 20Y8 20Y7 Sales $3,048,480 $2,808,690 Cost of goods sold (1,095,000) (1,007,400) Gross profit $1,953,480 $1,801,290 Selling expenses $(702,710) $(838,590) Administrative expenses (598,600) (492,510) Total operating expenses (1,301,310) (1,331,100) Operating income $652,170 $470,190...
Twenty metrics of liquidity, Solvency, and Profitability The comparative financial statements of Automotive Solutions Inc. are...
Twenty metrics of liquidity, Solvency, and Profitability The comparative financial statements of Automotive Solutions Inc. are as follows. The market price of Automotive Solutions Inc. common stock was $119.70 on December 31, 20Y8. AUTOMOTIVE SOLUTIONS INC. Comparative Income Statement For the Years Ended December 31, 20Y8 and 20Y7 20Y8 20Y7 Sales $10,000,000 $ 9,400,000 Cost of goods sold (5,350,000) (4,950,000) Gross profit $ 4,650,000 $ 4,450,000 Selling expenses $ (2,000,000) $(1,880,000) Administrative expenses (1,500,000) (1,410,000) Total operating expenses $ (3,500,000)...
Twenty metrics of liquidity, Solvency, and Profitability The comparative financial statements of Automotive Solutions In...
Twenty metrics of liquidity, Solvency, and Profitability The comparative financial statements of Automotive Solutions Inc. are as follows. The market price of Automotive Solutions Inc. common stock was $65 on December 31, 20Y8. AUTOMOTIVE SOLUTIONS INC. Comparative Income Statement For the Years Ended December 31, 20Y8 and 20Y7 20Y8 20Y7 Sales $2,163,720 $1,993,570 Cost of goods sold (882,570) (811,960) Gross profit $1,281,150 $1,181,610 Selling expenses $(395,770) $(509,430) Administrative expenses (337,140) (299,190) Total operating expenses (732,910) (808,620) Operating income $548,240 $372,990...
Twenty metrics of liquidity, Solvency, and Profitability The comparative financial statements of Automotive Solutions Inc. are...
Twenty metrics of liquidity, Solvency, and Profitability The comparative financial statements of Automotive Solutions Inc. are as follows. The market price of Automotive Solutions Inc. common stock was $66 on December 31, 20Y8. AUTOMOTIVE SOLUTIONS INC. Comparative Income Statement For the Years Ended December 31, 20Y8 and 20Y7 20Y8 20Y7 Sales $5,409,300 $4,983,820 Cost of goods sold (2,124,300) (1,954,360) Gross profit $3,285,000 $3,029,460 Selling expenses $(1,001,580) $(1,264,600) Administrative expenses (853,200) (742,700) Total operating expenses (1,854,780) (2,007,300) Operating income $1,430,220 $1,022,160...
eBook Print Item Twenty metrics of liquidity, Solvency, and Profitability The comparative financial statements of Automotive Solutions Inc. are as follows. The market price of Auto...
 eBook Print Item Twenty metrics of liquidity, Solvency, and Profitability The comparative financial statements of Automotive Solutions Inc. are as follows. The market price of Automotive Solutions inc. common stock was $57 on December 31, 20Y8. AUTOMOTIVE SOLUTIONS INC. Comparative Income Statement For the Years Ended December 31, 20Y8 and 20Y7 20Y8 20Y7 Sales $2,759,400 $2,542,330 Cost of goods sold (1,016,160) (934,870) Gross profit $1,743,240 $1,607,460 Selling expenses $(565,630) $(699,550) Administrative expenses (481,830) (410,840) Total operating expenses (1,047,460) (1,110,390) Operating...
Twenty metrics of liquidity, Solvency, and Profitability The comparative financial statements of Automotive Solutions Inc. are...
Twenty metrics of liquidity, Solvency, and Profitability The comparative financial statements of Automotive Solutions Inc. are as follows. The market price of Automotive Solutions Inc. common stock was $58 on December 31, 20Y8. AUTOMOTIVE SOLUTIONS INC. Comparative Income Statement For the Years Ended December 31, 20Y8 and 20Y7 20Y8 20Y7 Sales $4,707,040 $4,336,800 Cost of goods sold (1,737,400) (1,598,410) Gross profit $2,969,640 $2,738,390 Selling expenses $(960,100) $(1,216,840) Administrative...
eBook Print Item Twenty metrics of liquidity, Solvency, and Profitability The comparative financial statements of Automotive...
 eBook Print Item Twenty metrics of liquidity, Solvency, and Profitability The comparative financial statements of Automotive Solutions Inc. are as follows. The market price of Automotive Solutions inc. common stock was $57 on December 31, 20Y8. AUTOMOTIVE SOLUTIONS INC. Comparative Income Statement For the Years Ended December 31, 20Y8 and 20Y7 20Y8 20Y7 Sales $2,759,400 $2,542,330 Cost of goods sold (1,016,160) (934,870) Gross profit $1,743,240 $1,607,460 Selling expenses $(565,630) $(699,550) Administrative expenses (481,830) (410,840) Total operating expenses (1,047,460) (1,110,390) Operating...
 eBook Print Item Twenty metrics of liquidity, Solvency, and Profitability The comparative financial statements of Automotive Solutions Inc. are as follows. The market price of Automotive Solutions inc. common stock was $57 on December 31, 20Y8. AUTOMOTIVE SOLUTIONS INC. Comparative Income Statement For the Years Ended December 31, 20Y8 and 20Y7 20Y8 20Y7 Sales $2,759,400 $2,542,330 Cost of goods sold (1,016,160) (934,870) Gross profit $1,743,240 $1,607,460 Selling expenses $(565,630) $(699,550) Administrative expenses (481,830) (410,840) Total operating expenses (1,047,460) (1,110,390) Operating...
 eBook Print Item Twenty metrics of liquidity, Solvency, and Profitability The comparative financial statements of Automotive Solutions Inc. are as follows. The market price of Automotive Solutions inc. common stock was $57 on December 31, 20Y8. AUTOMOTIVE SOLUTIONS INC. Comparative Income Statement For the Years Ended December 31, 20Y8 and 20Y7 20Y8 20Y7 Sales $2,759,400 $2,542,330 Cost of goods sold (1,016,160) (934,870) Gross profit $1,743,240 $1,607,460 Selling expenses $(565,630) $(699,550) Administrative expenses (481,830) (410,840) Total operating expenses (1,047,460) (1,110,390) Operating...
Most questions answered within 3 hours.
-
In 2017, Juan entered into a contract to write a book. The
publisher advanced Juan $50,000,...
asked 5 minutes ago -
Determine the number of kinds of protons in each molecule (w/
respect to NMR spectroscopy). Drawing...
asked 15 minutes ago -
A jeweler whose near point is 68 cm from his eye uses a
magnifying glass as...
asked 13 minutes ago -
A company wants to determine how many units of each of two
products, A and B,...
asked 17 minutes ago -
The blood pressure of a person changes throughout the day.
Suppose the systolic blood pressure of...
asked 26 minutes ago -
A chemistry student desired to study sulfur. Sulfur exhibited
the following characteristics with oxygen:
(a) It...
asked 22 minutes ago -
An Atwood machine is constructed of a solid-disk frictionless
pulley of mass m3 and radius R....
asked 24 minutes ago -
what are the advantages of lanthanum hexaboride over tungsten
filament for electron emission
what is the...
asked 25 minutes ago -
Question 5
Your uncle offers to sell you his vintage Rolls Royce. He
suggests a payment...
asked 30 minutes ago -
Quality grading of beef products as Prime, Choice, Select. What
type of data?
A) ratio
B)...
asked 39 minutes ago -
For the following unbalanced reaction at 0.800
atm and 34.5°C:
MoS2(s) + O2(g) → MoO3(s) +...
asked 47 minutes ago -
When 12 mL of 0.2 M NaOH is added to 25 mL of 0.15 M HCl,...
asked 51 minutes ago