Given data: Weight of female nurses in a hospital in lbs. 110 98 119 105 99 &nbs
- Given data: Weight of female nurses in a hospital in lbs.
110 98 119 105 99 100 100 110
Compute the ff. using ungrouped data
- Mean
- Median
- Mode
- Variance
- Standard deviation
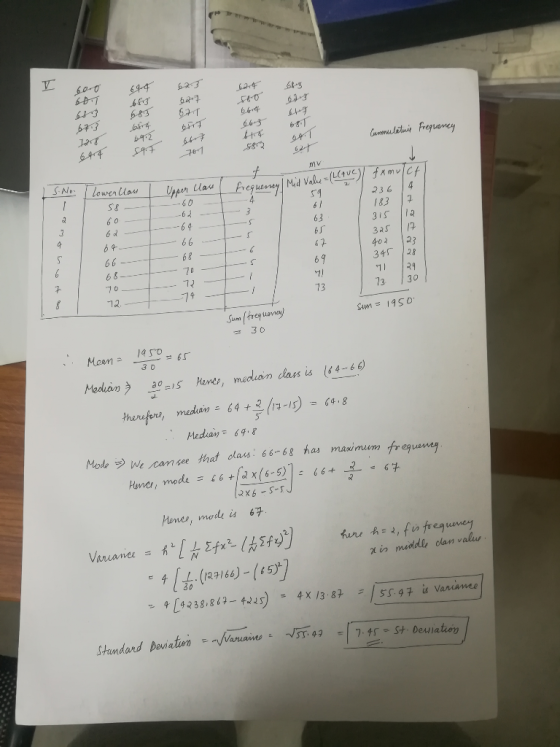
V. The following data represent the respective heights (in inches) of 30 students enrolled in a physical education class. Construct a frequency distribution with eight class intervals.
60.0 59.7 70.1 58.2 62.1
60.1 62.3 62.4 68.3 63.3
67.3 62.7 58.0 67.3 72.8
64.4 67.1 66.4 61.7 69.4
65.3 65.7 66.3 68.1 68.3
65.4 66.7 61.4 64.1 69.2
- Solve the ff. using grouped data:
- Mean
- Median
- Mode
- Variance
- Standard Deviation
- Draw bar graph
- Here's the data for the 20 individuals all male where height is measured in inches. Self esteem is measured based on the average of 10 1-to-5 rating items where higher scores mean higher self esteem. Compute correlation coefficient.
|
Person |
Height |
Self Esteem |
|
1 |
68 |
4.1 |
|
2 |
71 |
4.6 |
|
3 |
62 |
3.8 |
|
4 |
75 |
4.4 |
|
5 |
58 |
3.2 |
|
6 |
60 |
3.1 |
|
7 |
67 |
3.8 |
|
8 |
68 |
4.1 |
|
9 |
71 |
4.3 |
|
10 |
69 |
3.7 |
|
11 |
68 |
3.5 |
|
12 |
67 |
3.2 |
|
13 |
63 |
3.7 |
|
14 |
62 |
3.3 |
|
15 |
60 |
3.4 |
|
16 |
63 |
4.0 |
|
17 |
65 |
4.1 |
|
18 |
67 |
3.8 |
|
19 |
63 |
3.4 |
|
20 |
61 |
3.6 |
Homework Answers
1. Here we have to compute s
ummary statistics i.e. mean, median, mode, variance, standard deviation.
For mean we have,
where Xi is observations and N is total no of observations.
So we have, =
(110+98+119+105+99+100+100+110)/8 =92.625=mean.
For mode, we know that it is the value that occurs max no of time in data, hence mode is 100
Median is the value which occurs in the middle of the list of values given hence, on rearranging the values we get, 98,99,100,100,105,110,110,119. We can see that 100 is the middle most value hence it is the median of given data.
![3 S$ 60 62 6牛 6668707s 14 629 6.&I 2 5041 al 3266 23S4 33 244 14.44 9 36 10 4 9-6 14.44 16 R +--5625- マ 3 3 69 63600 4 929 186 234.6 30s 3 38 233 に41 04) 6I 464 24989 3144 36 00 13.69 1a.as b 34 3 69 又14,4. 20914 ir 文bbig 63969 16.8 4.44 4025 24461 3461 40 372] S9.6 219. 219.6 2-94 Sum 4933.4 um85912 errelatm 20 246.88-245 577 130367313 4 0. 41S3 7R 163? 4.29](http://img.homeworklib.com/questions/71e59970-7163-11ea-970c-89449d0db642.png?x-oss-process=image/resize,w_560)
Add Answer to:
Given
data: Weight of female
nurses in a hospital in lbs.
110
98 119
105 99 &nbs
QUESTION 1 a) Consider the data of Table 1.1 which specifies the "life" of 40 similar...
 QUESTION 1 a) Consider the data of Table 1.1 which specifies the "life" of 40 similar car batteries recorded to the nearest tenth of a year. The batteries are guaranteed to last 3 years. Table 1.1 3.5 2.2 3.4 2.5 3.3 4.1 1.6 4.3 3.1 3.8 3.1 3.4 3.7 3.4 4.5 3.3 3.6 4.4 2.6 3.2 3.8 2.9 3.2 3.9 3.7 3.1 3.3 4.1 3.0 3.0 4.7 3.9 1.9 4.2 2.6 3.7 3.1 3.4 3.5 4.7 (i) Represent the above...
Student What is your height in inches? What is your weight in pounds? What is your...
Student What is your height in inches? What is your weight in pounds? What is your cumulative Grade Point Average (GPA) at FTCC or your primary college? How many hours do you sleep each night? 1 67 100 4 7 2 62 105 4 5 3 72 120 4 8 4 61 125 4 7 5 56 105 3.7 6 6 61 120 4 7 7 65 172 3.8 7 8 72 235 3.22 5 9 63 135 4 6...
The subjects in the data are college students. In the data, id is student ID, anxiety...
The subjects in the data are college students. In the data, id is student ID, anxiety is student’s anxiety score via Anxiety Scale, selfest is student’s self-esteem score via Rosenberg Self-esteem Scale, GPA is student’s GPA; for gender, 0=female, 1=male; for grade, 1=freshman, 2=junior, 3=senior. We have known that population mean for Anxiety Scale is μ=60 with σ=10. Raise relevant questions ( 2 questions is fine) about the data extensively, the questions can be either about descriptive analysis or inferential...
ntroduce your scenario and data set. Provide a brief overview of the scenario you are given...
ntroduce your scenario and data set. Provide a brief overview of the scenario you are given above and the data set that you will be analyzing. Classify the variables in your data set. Which variables are quantitative/qualitative? Which variables are discrete/continuous? Describe the level of measurement for each variable included in your data set. Discuss the importance of the Measures of Center and the Measures of Variation. What are the measures of center and why are they important? What are...
Who Watches More TV: Males or Females? Use technology and the StudentSurvey dataset to test whether...
 Who Watches More TV: Males or Females? Use technology and the StudentSurvey dataset to test whether the data provide evidence that there is a difference in the mean number of hours spent watching television per week between males and females. Click here for the dataset associated with this question. What are the hypotheses? Use subscripts 1 for females and 2 for males. 11 1 H HP UP HP HIP 11 12 11 Pi 1: P2 G TV Piercing B Gender...
Refer to the accompanying data set and construct a 90% confidence interval estimate of the mean...
 Refer to the accompanying data set and construct a 90% confidence interval estimate of the mean pulse rate of adult females then do the same for adult males Compare the results Click the icon to view the pulse rates for adult females and adult males Construct a 90% confidence interval of the mean pulse rate for adult females Pulse Rates - X bpm bpm (Round to one decimal place as needed) Males 85 69 75 65 51 74 57 73...
QUESTION 7 The data set Beer Large, which can be found in StatCrunch Shared Data Sets,...
 QUESTION 7 The data set Beer Large, which can be found in StatCrunch Shared Data Sets, gives the Alcohol, Carbohydrates and Calories for different brands of beer. The explanatory variable is x + Carbohydrates and the response variable is Y - Calories. Use this information to answer: Calculate the correlation between carbohydrates and calories. (4 decimal places) Row vars varo var var 8 var9 var 10 2 الميا ABV 4.1 5.4 4.43 4.13 5.9 4.9 Carbs 2.6 13.7 5.8 5...
HELP needed urgently....Data and question is attacted below..... Thank you in advance there is no data...
 HELP needed urgently....Data and question is attacted below.....
Thank you in advance
there is no data link fir this data it’s all in photos.... thank
you
i
have already posted the question
We were unable to transcribe this imageNo. 2 3 4 5 6 7 8 Working Sector Public Own Public Public Private Public Private Private Own Own Private Public Public Public Private 9 10 11 12 13 Public IS 16 17 18 19 20 21 22 23 24 25...
HELP needed urgently....Data and question is attacted below.....
Thank you in advance
there is no data link fir this data it’s all in photos.... thank
you
i
have already posted the question
We were unable to transcribe this imageNo. 2 3 4 5 6 7 8 Working Sector Public Own Public Public Private Public Private Private Own Own Private Public Public Public Private 9 10 11 12 13 Public IS 16 17 18 19 20 21 22 23 24 25...
Python Pandas, Series and DataFrame Question (NO Loops, No If Statements, No List Comprehensions) The file...
Python Pandas, Series and DataFrame Question (NO Loops, No If Statements, No List Comprehensions) The file bank.csv contains data about bank customers. The last column ('Personal Loan') indicates whether or not the customer was approved for a personal loan or not. Write a function named loan_by_zip that accepts 3 parameters: a file name, a minimum number of records, and a percentage approval rate. The function should return a DataFrame of those zip codes for which we meet the minimum number...
 QUESTION 1 a) Consider the data of Table 1.1 which specifies the "life" of 40 similar car batteries recorded to the nearest tenth of a year. The batteries are guaranteed to last 3 years. Table 1.1 3.5 2.2 3.4 2.5 3.3 4.1 1.6 4.3 3.1 3.8 3.1 3.4 3.7 3.4 4.5 3.3 3.6 4.4 2.6 3.2 3.8 2.9 3.2 3.9 3.7 3.1 3.3 4.1 3.0 3.0 4.7 3.9 1.9 4.2 2.6 3.7 3.1 3.4 3.5 4.7 (i) Represent the above...
 Who Watches More TV: Males or Females? Use technology and the StudentSurvey dataset to test whether the data provide evidence that there is a difference in the mean number of hours spent watching television per week between males and females. Click here for the dataset associated with this question. What are the hypotheses? Use subscripts 1 for females and 2 for males. 11 1 H HP UP HP HIP 11 12 11 Pi 1: P2 G TV Piercing B Gender...
 Refer to the accompanying data set and construct a 90% confidence interval estimate of the mean pulse rate of adult females then do the same for adult males Compare the results Click the icon to view the pulse rates for adult females and adult males Construct a 90% confidence interval of the mean pulse rate for adult females Pulse Rates - X bpm bpm (Round to one decimal place as needed) Males 85 69 75 65 51 74 57 73...
 QUESTION 7 The data set Beer Large, which can be found in StatCrunch Shared Data Sets, gives the Alcohol, Carbohydrates and Calories for different brands of beer. The explanatory variable is x + Carbohydrates and the response variable is Y - Calories. Use this information to answer: Calculate the correlation between carbohydrates and calories. (4 decimal places) Row vars varo var var 8 var9 var 10 2 الميا ABV 4.1 5.4 4.43 4.13 5.9 4.9 Carbs 2.6 13.7 5.8 5...
 HELP needed urgently....Data and question is attacted below.....
Thank you in advance
there is no data link fir this data it’s all in photos.... thank
you
i
have already posted the question
We were unable to transcribe this imageNo. 2 3 4 5 6 7 8 Working Sector Public Own Public Public Private Public Private Private Own Own Private Public Public Public Private 9 10 11 12 13 Public IS 16 17 18 19 20 21 22 23 24 25...
HELP needed urgently....Data and question is attacted below.....
Thank you in advance
there is no data link fir this data it’s all in photos.... thank
you
i
have already posted the question
We were unable to transcribe this imageNo. 2 3 4 5 6 7 8 Working Sector Public Own Public Public Private Public Private Private Own Own Private Public Public Public Private 9 10 11 12 13 Public IS 16 17 18 19 20 21 22 23 24 25...
Most questions answered within 3 hours.
-
Write a program to solve the Josephus problem, with the following
modification:
Sample Input:
./a.out n...
asked 1 hour ago -
At the start of a CD it is spinning at a rate of 525 rpm
(revolutions...
asked 1 hour ago -
4. Without doing any calculations, predict whether the observed
∆T would increase, decrease or remain the...
asked 3 hours ago -
Based on the range, which of the following sets of scores has
the greatest variability? 3,...
asked 4 hours ago -
Ripples in a pond travel at a velocity of 3 m/s with one peak
passing a...
asked 4 hours ago -
A man stands on the roof of a building of height 13.0 mm and
throws a...
asked 4 hours ago -
The extent to which assets are financed by borrowed funds and
other liabilities is indicated by:...
asked 5 hours ago -
Explain in detail
Germany is the fifth largest economy
explain what goods and services Germany specializes...
asked 5 hours ago -
The density of platinum is 21.45 g/mL. If a cube of platinum
with a mass of...
asked 5 hours ago -
Accounts Receivable
Sales
A/R Posting
Extended Sales Invoice
Packing Slip
Compare invoice to packing slip 2...
asked 5 hours ago -
Michaella, age 23, is a full-time law student and is claimed by
her parents as a...
asked 5 hours ago -
Why are polymers not typically casted into products?
asked 5 hours ago