
Homework Answers


Add Answer to:
QUESTION 1 a) Consider the data of Table 1.1 which specifies the "life" of 40 similar...
Single data values (in hours): 3, 1, 4, 5, 5, 2, 2.5, 3.5, 4, 4.5, 0,...
Single data values (in hours): 3, 1, 4, 5, 5, 2, 2.5, 3.5, 4, 4.5, 0, 2, 2, 2.5, 3.5, 4, 4, 4, 4, 2, 3.5, 3.5, 2, 3, 4, 4, 3, 3, 3, 1 Paired data values: Athletes Non-athletes 3.7 2.5 3.1 4.1 4.2 4.2 4.2 4.2 3.4 3.0 3.7 3.8 2.1 2.1 3.5 2.7 3.6 1.8 4.0 2.0 2.9 3.6 3.2 3.9 2.9 2.6 3.5 2.8 3.6 3.1 3.4 3.5 2.9 3.5 3.9 3.6 2.8 2.9 3.1 2.7...
Recent research indicates that the effectiveness of antidepressant medication is directly related to the severity of...
Recent research indicates that the effectiveness of antidepressant medication is directly related to the severity of the depression (Khan, Brodhead, Kolts & Brown, 2005). Based on pretreatment depression scores, patients were divided into four groups based on their level of depression. After receiving the antidepressant medication, depression scores were measured again and the amount of improvement was recorded for each patient. The following data are similar to the results of the study. Low Moderate High Moderate Moderately Severe Severe 1.2...
The table below gives the birth weights in pounds of piglets in 8 randomly selected litters...
The table below gives the birth weights in pounds of piglets in 8 randomly selected litters from large number of litters in a state. Litter 1 2 3 4 5 6 7 8 2.0 3.5 3.3 3.2 2.6 3.1 2.6 2.5 2.8 2.8 1.6 3.3 2.6 2.9 2.2 2.4 3.3 3.2 3.6 3.2 2.9 3.1 2.2 3.0 3.2 3.5 3.1 1.9 2.0 2.5 2.5 1.5 4.4 2.3 3.2 3.3 2.0 1.2 3.6 2.4 3.3 2.5 2.1 1.2 1.9 2.0 2.9 ...
Thirty-two college students, identified as having a posative attiude about Mitty Romney as compared to B....
Thirty-two college students, identified as having a posative attiude about Mitty Romney as compared to B. Obama in the 2012 presidentioal election, were asked to rate how trustworthy the face of M. Romeny appeared, as represented in their in their mental image of M. Romeny's face. Ratings were on a scale 0 to 7, with 0 being " not at all trustworthy" and 7 being "extremly trustworthy." here are the 32 ratings: 2.0 , 2.2 , 2.3 , 2.6 ,...
Good Luck. (Need to show all your work to get full credit; no work, no credit)...
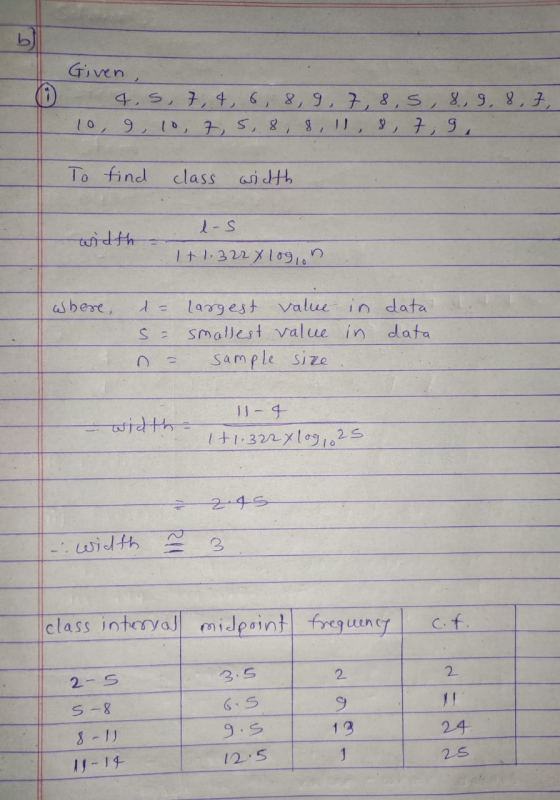
 Good Luck. (Need to show all your work to get full credit; no work, no credit) 1.For the given sample data below: a Construct a frequency distribution using six classes for a sample data that includes. Class Limits (5 pts), Class Boundaries (6 pts), Frequency (3 pts), Relative frequency (3 pts), Cumulative Frequency (3 pts), Midpoint X.5 pts), f-x-(5 pts), f. (6 pts). b. For constructed grouped data find: mean (8 pts), mode for grouped data (2 pts), modal class...
A product has three quality characteristics. The nominal values of these quality characteristics and their sample...
 A product has three quality characteristics. The nominal values
of these quality characteristics and their sample covariance matrix
have been determined from the analysis of 30 preliminary samples of
size n=10 as it is show in the Excel file. The sample means for
each quality characteristic for 15 additional samples of size n=10
are shown in table. Is the process in statistical control?
X2 Tz Sample number 1 2 [1.40 1.021.05] S = 1.02 1.350.98 11.05 0.98 1.20) 3.1 3.3...
A product has three quality characteristics. The nominal values
of these quality characteristics and their sample covariance matrix
have been determined from the analysis of 30 preliminary samples of
size n=10 as it is show in the Excel file. The sample means for
each quality characteristic for 15 additional samples of size n=10
are shown in table. Is the process in statistical control?
X2 Tz Sample number 1 2 [1.40 1.021.05] S = 1.02 1.350.98 11.05 0.98 1.20) 3.1 3.3...
Life has been measured in years of 40 electric batteries, seven classes have been created, and...
 Life has been measured in years of 40 electric batteries, seven classes have been created, and the number of observations belonging to each class has been counted, resulting in the following table AbsoluteAccumulated Relative Accumulated Class Class (Interval)mark frequency frequencyfrequency relative frequency 2 1.7 2.2 2.7 3.4 3.7 4.2 4.7 1.5-1.9 2.0-2.4 2.5-2.9 3.0-3.4 3.5-3.9 4.0-4.4 4.5-4.9 4 15 10 3 Find the cumulative frequency (fill in the corresponding column) Find the relative frequency (fill in the corresponding column) Find...
Parametirc test or not: Test statistic: p-value: decision: Is There A Difference Between the Means?
Parametirc test or not:Test statistic:p-value:decision:Is There A Difference Between the Means?6.7 6.2 3.1 310.3 10 5 5.56.9 5.5 3.3 3.110.5 6.3 4.3 5.44.5 4.6 1.8 25.6 5.6 2 2.65.9 6.1 2.1 2.58 11.7 4 4.68 7.4 3.3 3.15.8 5.2 3.1 2.96 7.3 3.0 3.28.7 5.3 2.7 36 5.5 2.1 2.27.2 6.3 3.5 3.25.9 4.6 2.9 3.46 7.4 3 3.37.2 7.8 3.7 3.48.6 9.4 5.1 5.77.2 8.1 2.8 3.15.8 5.4 2.2 1.83.3 4 1.7 1.86.8 5.1 2 1.83.7 3.5 2.2 2.112...
Use only Minitab if you won't use Minitab leave it for another person to work on it please. The breaking strengths of carbon fibers, which are used in fibrous composite materials, were measured by...
 Use only Minitab if you won't
use Minitab leave it for another person to work on it please.
The breaking strengths of carbon fibers, which are used in fibrous composite materials, were measured by randomly selecting samples of 5 fibers. See attached data spreadsheet contains the data. a. Form an x-bar/R chart. b. Based on your answer to part a, would you say that the process is in control, or 1. not? Explain your answer. Also, discuss anything unusual that...
Use only Minitab if you won't
use Minitab leave it for another person to work on it please.
The breaking strengths of carbon fibers, which are used in fibrous composite materials, were measured by randomly selecting samples of 5 fibers. See attached data spreadsheet contains the data. a. Form an x-bar/R chart. b. Based on your answer to part a, would you say that the process is in control, or 1. not? Explain your answer. Also, discuss anything unusual that...
The following data were obtained from a 14ft (drill length) core in shale with discontinuities-bedding surface...
 The following data were obtained from a 14ft (drill length) core in shale with discontinuities-bedding surface and high angle joints. Measurements are in inches (in) 5.7 1.3 0.5 1.1 5.3 1.3 3.4 0.3 2.0 4.3 3.2 1.2 2.3 2.9 2,8 3,2 1.2 1.2 3.0 6.2 2.9 6.4 2.6 2.6 3.5 1.0 0.5 1.1 6.8 0.3 0.9 1.7 2.1 5,9 0.9 2.0 0.5 3.1 2.3 4.1 4.2 2.2 2.8 4.3 2.0 4.4 4.5 3.6 0.5 2.1 Calculate the core loss (15...
 Good Luck. (Need to show all your work to get full credit; no work, no credit) 1.For the given sample data below: a Construct a frequency distribution using six classes for a sample data that includes. Class Limits (5 pts), Class Boundaries (6 pts), Frequency (3 pts), Relative frequency (3 pts), Cumulative Frequency (3 pts), Midpoint X.5 pts), f-x-(5 pts), f. (6 pts). b. For constructed grouped data find: mean (8 pts), mode for grouped data (2 pts), modal class...
 A product has three quality characteristics. The nominal values
of these quality characteristics and their sample covariance matrix
have been determined from the analysis of 30 preliminary samples of
size n=10 as it is show in the Excel file. The sample means for
each quality characteristic for 15 additional samples of size n=10
are shown in table. Is the process in statistical control?
X2 Tz Sample number 1 2 [1.40 1.021.05] S = 1.02 1.350.98 11.05 0.98 1.20) 3.1 3.3...
A product has three quality characteristics. The nominal values
of these quality characteristics and their sample covariance matrix
have been determined from the analysis of 30 preliminary samples of
size n=10 as it is show in the Excel file. The sample means for
each quality characteristic for 15 additional samples of size n=10
are shown in table. Is the process in statistical control?
X2 Tz Sample number 1 2 [1.40 1.021.05] S = 1.02 1.350.98 11.05 0.98 1.20) 3.1 3.3...
 Life has been measured in years of 40 electric batteries, seven classes have been created, and the number of observations belonging to each class has been counted, resulting in the following table AbsoluteAccumulated Relative Accumulated Class Class (Interval)mark frequency frequencyfrequency relative frequency 2 1.7 2.2 2.7 3.4 3.7 4.2 4.7 1.5-1.9 2.0-2.4 2.5-2.9 3.0-3.4 3.5-3.9 4.0-4.4 4.5-4.9 4 15 10 3 Find the cumulative frequency (fill in the corresponding column) Find the relative frequency (fill in the corresponding column) Find...
 Use only Minitab if you won't
use Minitab leave it for another person to work on it please.
The breaking strengths of carbon fibers, which are used in fibrous composite materials, were measured by randomly selecting samples of 5 fibers. See attached data spreadsheet contains the data. a. Form an x-bar/R chart. b. Based on your answer to part a, would you say that the process is in control, or 1. not? Explain your answer. Also, discuss anything unusual that...
Use only Minitab if you won't
use Minitab leave it for another person to work on it please.
The breaking strengths of carbon fibers, which are used in fibrous composite materials, were measured by randomly selecting samples of 5 fibers. See attached data spreadsheet contains the data. a. Form an x-bar/R chart. b. Based on your answer to part a, would you say that the process is in control, or 1. not? Explain your answer. Also, discuss anything unusual that...
 The following data were obtained from a 14ft (drill length) core in shale with discontinuities-bedding surface and high angle joints. Measurements are in inches (in) 5.7 1.3 0.5 1.1 5.3 1.3 3.4 0.3 2.0 4.3 3.2 1.2 2.3 2.9 2,8 3,2 1.2 1.2 3.0 6.2 2.9 6.4 2.6 2.6 3.5 1.0 0.5 1.1 6.8 0.3 0.9 1.7 2.1 5,9 0.9 2.0 0.5 3.1 2.3 4.1 4.2 2.2 2.8 4.3 2.0 4.4 4.5 3.6 0.5 2.1 Calculate the core loss (15...
Most questions answered within 3 hours.
-
Considering the “fits” for group and job design dimensions,
suppose you had 12 employees with different...
asked 3 minutes ago -
Consider TCP connection management.
How many segments are typically involved in the TCP connection
establishment? What...
asked 13 minutes ago -
1. You placed a stop-loss order to sell 500 shares of AAPL with
a stop price...
asked 20 minutes ago -
Sylva Warehousing desired to locate a central warehouse to serve
five North Carolina markets. Placed on...
asked 22 minutes ago -
A regression was run to determine if there is a relationship
between hours of TV watched...
asked 30 minutes ago -
The theoretical yield of a reaction is the amount of product
obtained if the limiting reactant...
asked 37 minutes ago -
You are an intern at a leading investment bank. Your manager
assigned you a project to...
asked 35 minutes ago -
Please explain how to determine polarity for me.
Rank the following covalent bonds by decreasing
polarity....
asked 38 minutes ago -
1. Express the confidence interval 86.5%±4.6% in interval
form
2. Assume that a sample is used...
asked 54 minutes ago -
Suppose in the short run a firm’s production function is given
by Q = L1/2*K1/2, and...
asked 1 hour ago -
Calculation of number of protons, neutrons , and electrons
If given the mass # of 74...
asked 1 hour ago -
On the Apollo 14 mission to the moon, astronaut Alan Shepard hit
a golf ball with...
asked 1 hour ago