Noise levels at 66 manufacturing plants were measured in decibels yielding the following data: 132,148,139,105,126,118 Construct...
Noise levels at 66 manufacturing plants were measured in decibels yielding the following data:
132,148,139,105,126,118
Construct the 95%confidence interval for the mean noise level at such locations. Assume the population is approximately normal.
1.Calculate the sample mean for the given sample data. Round your answer to one decimal place.
2.Calculate the sample standard deviation for the given sample data. Round your answer to one decimal place.
3.Find the critical value that should be used in constructing the confidence interval. Round your answer to three decimal places.
4. Construct the 95%95% confidence interval. Round your answer to one decimal place.
Homework Answers
Solution:
Given: Noise levels at 6 manufacturing plants were measured in decibels yielding the following data:
132,148,139,105,126,118
We have to construct the 95%confidence interval for the mean noise level at such locations.
Part 1) Calculate the sample mean for the given sample data

| x |
| 132 |
| 148 |
| 139 |
| 105 |
| 126 |
| 118 |
 |
Thus


Part 2) Calculate the sample standard deviation for the given sample data.

| x | x^2 |
| 132 | 17424 |
| 148 | 21904 |
| 139 | 19321 |
| 105 | 11025 |
| 126 | 15876 |
| 118 | 13924 |
|
|
 |
Thus


Part 3) Find the critical value that should be used in constructing the confidence interval.
df = n -1 = 6 - 1 = 5
two tail area = 1 - c = 1 - 0.95 = 0.05

tc = 2.571
Part 4) Construct the 95% confidence interval.
Formula;

where
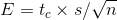
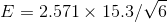


Thus


Thus the 95%confidence interval for the mean noise level at such
locations is :
Add Answer to:
Noise levels at 66 manufacturing plants were measured in
decibels yielding the following data:
132,148,139,105,126,118
Construct...
Noise levels at 66 manufacturing plants were measured in decibels yielding the following data: 147,144,146,127,154,140147,144,146,127,154,140 Construct...
Noise levels at 66 manufacturing plants were measured in decibels yielding the following data: 147,144,146,127,154,140147,144,146,127,154,140 Construct the 80%80% confidence interval for the mean noise level at such locations. Assume the population is approximately normal. Copy Data Step 4 of 4: Construct the 80%80% confidence interval. Round your answer to one decimal place.
Noise levels at 3 manufacturing plants were measured in decibels yielding the following data: 168,157,160. Construct...
Noise levels at 3 manufacturing plants were measured in decibels yielding the following data: 168,157,160. Construct the 80 % confidence interval for the mean noise level at such locations. Assume the population is approximately normal. Copy Data Step 4 of 4 : Construct the 80 % confidence interval. Round your answer to one decimal place.
Noise levels at 5 airports were measured in decibels yielding the following data: 146,162,170,152,187 Construct the...
Noise levels at 5 airports were measured in decibels yielding the following data: 146,162,170,152,187 Construct the 80% confidence interval for the mean noise level at such locations. Assume the population is approximately normal. Step 1 of 4 : Calculate the sample mean for the given sample data. Round your answer to one decimal place.
Noise levels at 3 volcanoes were measured in decibels yielding the following data: 142,113,135 Construct the...
Noise levels at 3 volcanoes were measured in decibels yielding the following data: 142,113,135 Construct the 90% confidence interval for the mean noise level at such locations. Assume the population is approximately normal. Step 1 of 4: Calculate the sample mean for the given sample data. Round your answer to one decimal place.
Noise levels at 3 concerts were measured in decibels yielding the following data: 124,134,134 Construct the...
Noise levels at 3 concerts were measured in decibels yielding the following data: 124,134,134 Construct the 98% confidence interval for the mean noise level at such locations. Assume the population is approximately normal.
A certain test preparation course is designed to help students improve their scores on the GRE...
A certain test preparation course is designed to help students improve their scores on the GRE exam. A mock exam is given at the beginning and end of the course to determine the effectiveness of the course. The following measurements are the net change in 55 students' scores on the exam after completing the course: 16,12,11,13,26 Using these data, construct a 95% confidence interval for the average net change in a student's score after completing the course. Assume the population...
The following measurements (in picocuries per liter) were recorded by a set of argon gas detectors...
The following measurements (in picocuries per liter) were recorded by a set of argon gas detectors installed in a research facility: 831.7, 847.2, 820.9, 826.3 Using these measurements, construct a 95% confidence interval for the mean level of argon gas present in the facility. Assume the population is approximately normal. Step 1. Calculate the sample mean for the given sample data. Round your answer to two decimal places. Answer: ____________________ Step 2. Calculate the sample standard deviation for the given...
The following measurements (in picocuries per liter) were recorded by a set of xenon gas detectors...
The following measurements (in picocuries per liter) were recorded by a set of xenon gas detectors installed in a waste disposal facility: 622.2, 619.6, 632.4, 652.8, 634.4, 637.3 Using these measurements, construct a 95% confidence interval for the mean level of xenon gas present in the facility. Assume the population is approximately normal. Step 1 of 4: Calculate the sample mean for the given sample data. Round your answer to two decimal places. Step 2 of 4: Calculate the sample...
A certain test preparation course is designed to help students improve their scores on the GMAT...
A certain test preparation course is designed to help students improve their scores on the GMAT exam. A mock exam is given at the beginning and end of the course to determine the effectiveness of the course. The following measurements are the net change in 55 students' scores on the exam after completing the course: 14,29,24,10,17 Using these data, construct a 90%confidence interval for the average net change in a student's score after completing the course. Assume the population is...
3,17,26,20,20 Using these data, construct a 98% confidence interval for the average net change in a...
3,17,26,20,20 Using these data, construct a 98% confidence interval for the average net change in a student's score after completing the course. Assume the population is approximately normal. Step 1 of 4: Calculate the sample mean for the given sample data. Round your answer to one decimal place. Standard deviation? critical value? lower and upper?
Most questions answered within 3 hours.
-
The blues made its way into many kinds of music. Eric Clapton,
The Beatles, and Elvis...
asked 1 hour ago -
8. A wave in a string has a wave function given by: y (x, t) =...
asked 21 minutes ago -
If you’re standing at the bottom of a hill and asked to evaluate
it while being...
asked 2 hours ago -
1. Which region has taken the lead in the world of
e-waste handling?
a) European Union...
asked 2 hours ago -
A 8.15- g bullet from a 9-mm pistol has a velocity of 366.0 m/s.
It strikes...
asked 3 hours ago -
The outstanding bonds of Alpha Extracts have a yield to maturity
of 7.4 percent and a...
asked 3 hours ago -
The Problem: The Case of the Harmonizing Vacations
Your CEO is exploring partnering with a European...
asked 4 hours ago -
A chemical equation is balanced by adding coefficients in front
of some formulas so that the...
asked 4 hours ago -
From the literature (reference your sources): What are the
lattice parameters of calcite and aragonite? Why...
asked 5 hours ago -
Your system is rejecting the question am asking which is
preceded by a case study. It...
asked 5 hours ago -
3. On January 2, 2000, Larry creates a trust with himself as
trustee. Larry as trustee...
asked 5 hours ago -
A member of the volleyball team spikes the ball. During this
process, she changes the velocity...
asked 5 hours ago