Part I: Law of Supply. In Microeconomics, the “Law of Supply” says that, if all else...
Part I: Law of Supply. In Microeconomics, the “Law of Supply” says that, if all else remains equal, an increase in price will result in an increase in the quantity supplied. Consider the price and demand data presented below:
|
x = price |
y = Quantity Supplied |
|
$3.00 |
209 |
|
$4.00 |
259 |
|
$4.25 |
542 |
|
$4.75 |
346 |
|
$5.00 |
379 |
|
$5.00 |
360 |
|
$6.50 |
781 |
|
$6.75 |
672 |
|
$8.00 |
873 |
|
$8.00 |
900 |
|
$9.50 |
969 |
|
$10.00 |
927 |
- Use software to find the correlation coefficient between the two variables price and quantity supplied.
- Is there a significant correlation between the two variables? Explain why or why not.
- Based on that correlation coefficient, describe the relationship between the two variables. Be sure to use two words from the following pairs: positive/negative and weak/strong.
- Use software to determine the equation of the regression line between the two variables where price is the explanatory variable (x) and quantity supplied is the response variable (y).
- Using that regression equation, predict the quantity supplied for this item if the price was set at $7.00.
- Using that regression equation, predict the quantity supplied for this item if the price was set at $15.00.
- Do you think the estimates from #5 and #6 are reliable? Explain why or why not.
- Based on this data, what percent of the variation in quantity supplied can be explained by the price?
Homework Answers
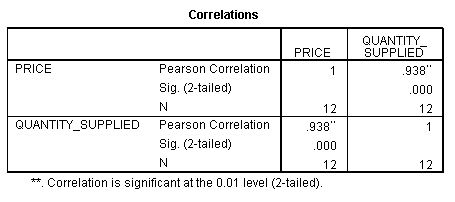
Correlation is 0.938
Positive and strong
It is significant at 0.01 level of significance.

y= -134.330 +118.113*Price
X= $7.00
Y(Quantity supplied)= -134.330+118.113*7
= -134.330+826.791
= 692.461
When X= $15
Y(Quantity supplied)= -134.330+118.113*15
Y(Quantity supplied)= 1637.365
Yes it is reliable values.
From above table
R squared that is coefficient of determination= 0.880
Therefore 88% of the variation in quantity supplied can be explained by the price.
Add Answer to:
Part I: Law of Supply. In Microeconomics, the
“Law of Supply” says that, if all else...
Problem 4 – Analysis of the law of demand Microeconomic theory states that an inverse relation...
Problem 4 – Analysis of the law of demand Microeconomic theory states that an inverse relation is likely to exist between price and quantity demanded for normal goods. To examine the validity of this theory in the market of apples, a market researcher observed the daily market price of a box of apples and the quantity of boxes of apples demanded in a local wholesaler fruit market over a period of nine days. By referring to data and additional information...
The manager of a seafood restaurant was asked to establish a pricing policy on lobster dinners....
 The manager of a seafood restaurant was asked to establish a pricing policy on lobster dinners. Experimenting with prices produced the following data Average number sold 158 159 154 134 131 129 118 113 114 105 Observation Price 6.00 6.50 6.75 7.00 7.25 7.75 8.00 8.25 8.50 8.75 9.00 9.25 2 3 4 6 7 8 9 10 12 79 a. Plot the graphfor the relationship between price and number of dinners sold. (Use scatter plot.) b. Determine the square...
i just beed help with part d on this problem. i do not understand why i...
 i just beed help with part d on this problem. i do not
understand why i got the answer wrong. thank you in advance
b. Develop the estimated regression equation that could be used to predict the selling price given the number of square feet of living space (to 3 decimals). 1 required enter negative values as negative numbers. 9-59.011 115.09 c. At the os level, is there a significant relationship between the two variables? p-value is .000 less thanos...
i just beed help with part d on this problem. i do not
understand why i got the answer wrong. thank you in advance
b. Develop the estimated regression equation that could be used to predict the selling price given the number of square feet of living space (to 3 decimals). 1 required enter negative values as negative numbers. 9-59.011 115.09 c. At the os level, is there a significant relationship between the two variables? p-value is .000 less thanos...
I need help answering these questions MULTIPLE CHOICE. Choose the one alternative that best completes the...
 I need help answering these questions
MULTIPLE CHOICE. Choose the one alternative that best completes the statement or answer the question. 1) The purpose of a linear regression line is to A) calculate the correlation coefficient B) display the bivariate distribution of X and Y C) identify the mean of the X and Y variables D) predict one set of scores from another set 2) The general equation for a straight line is expressed as A) Y - X- B)...
I need help answering these questions
MULTIPLE CHOICE. Choose the one alternative that best completes the statement or answer the question. 1) The purpose of a linear regression line is to A) calculate the correlation coefficient B) display the bivariate distribution of X and Y C) identify the mean of the X and Y variables D) predict one set of scores from another set 2) The general equation for a straight line is expressed as A) Y - X- B)...
# Part 3) PRICE 'ELASTICITY' (8 points) You are a financial manager for a unit within...
 # Part 3) PRICE 'ELASTICITY' (8 points) You are a financial manager for a unit within a textile company that specializes in zippers, buttons and other fasteners. Your area Vice President gives you the last 16 weeks of sales data for a recently launched product, the Elastiband 2.0 (units sold are in thousands). She asks you to analyze the data and provide a reliable sales forecast for the next four weeks. For your convenience, this data is provided in an...
11)A supply curve that is horizontally sloped is an accurate representation of the law of supply...
11)A supply curve that is horizontally sloped is an accurate representation of the law of supply given ceteris paribus when only price changes for a good is a: (a)False statement (b)True statement (c)More information needed to respond (d)All of the above (12)Positive economic analysis deals with_________________________ and normative economic analysis deals with_____________________ (a)What should be, what is (b)What is, what ought to be (c)Fiction, fact (d)Positive things, negative things (13)If given ceteris paribus there is a positive correlation between annual...
PART 2 PURPOSE The purpose of this the skill to estimate a demand function using statistical...
 PART 2 PURPOSE The purpose of this the skill to estimate a demand function using statistical software and interpret the findings. assignment is to provide the student with REQUIREMENT Household Manufacturing has collected the following data on quantity sold (Q). price (P), income (I), and advertising (A). Period Quantity, Q Price, P Income, Advertising, A 120 165 120 165 180 8.0 4.0 7.0 4.0 10.0 4.0 19 18 25 150 190 160 10.2 9.3 5.0 10 35 9.5 a Use...
Pick a minimum of 20 observations on any subject. This will include a dependent variable plus...
Pick a minimum of 20 observations on any subject. This will include a dependent variable plus two independent variables that you may think are either negatively or positively correlated with the dependent variable. List the observed data (include the source). Then do the following: a. State before doing any calculations whether you think they are positively or negatively correlated. What is your rationale? Example: I test for a correlation between the quantity of coffee that people buy (Y) with the...
Chapter 12 Project: Linear Regression and Correlation Student Learning Outcomes: • The student will calculate and...
 Chapter 12 Project: Linear Regression and Correlation Student Learning Outcomes: • The student will calculate and construct the line of best fit between two variables. • The student will evaluate the relationship between two variables to determine if that relationship is significant Data The table below gives total fuel efficiency (in miles per gallon) and mass (in kilograms) of 20 new model cars with automatic transmissions. We will use this data to determine the relationship, if any, between the fuel...
part 1 is done need help with part 2 please Regression and Correlation Part 1 -Hypothesis...
 part 1 is done need help with part 2 please
Regression and Correlation Part 1 -Hypothesis test for u a) Use the data provided Perform a complete hypothesis test (show all steps) of Ho: 4 = 42 Use a -.05 Word your conclusion clearly in plain English so that a 14-year-old would understand it. For this part of the assignment, we'll look to see if there's an association between the responses of your two numerical questions PART 2 - Regression...
part 1 is done need help with part 2 please
Regression and Correlation Part 1 -Hypothesis test for u a) Use the data provided Perform a complete hypothesis test (show all steps) of Ho: 4 = 42 Use a -.05 Word your conclusion clearly in plain English so that a 14-year-old would understand it. For this part of the assignment, we'll look to see if there's an association between the responses of your two numerical questions PART 2 - Regression...
 The manager of a seafood restaurant was asked to establish a pricing policy on lobster dinners. Experimenting with prices produced the following data Average number sold 158 159 154 134 131 129 118 113 114 105 Observation Price 6.00 6.50 6.75 7.00 7.25 7.75 8.00 8.25 8.50 8.75 9.00 9.25 2 3 4 6 7 8 9 10 12 79 a. Plot the graphfor the relationship between price and number of dinners sold. (Use scatter plot.) b. Determine the square...
 i just beed help with part d on this problem. i do not
understand why i got the answer wrong. thank you in advance
b. Develop the estimated regression equation that could be used to predict the selling price given the number of square feet of living space (to 3 decimals). 1 required enter negative values as negative numbers. 9-59.011 115.09 c. At the os level, is there a significant relationship between the two variables? p-value is .000 less thanos...
i just beed help with part d on this problem. i do not
understand why i got the answer wrong. thank you in advance
b. Develop the estimated regression equation that could be used to predict the selling price given the number of square feet of living space (to 3 decimals). 1 required enter negative values as negative numbers. 9-59.011 115.09 c. At the os level, is there a significant relationship between the two variables? p-value is .000 less thanos...
 I need help answering these questions
MULTIPLE CHOICE. Choose the one alternative that best completes the statement or answer the question. 1) The purpose of a linear regression line is to A) calculate the correlation coefficient B) display the bivariate distribution of X and Y C) identify the mean of the X and Y variables D) predict one set of scores from another set 2) The general equation for a straight line is expressed as A) Y - X- B)...
I need help answering these questions
MULTIPLE CHOICE. Choose the one alternative that best completes the statement or answer the question. 1) The purpose of a linear regression line is to A) calculate the correlation coefficient B) display the bivariate distribution of X and Y C) identify the mean of the X and Y variables D) predict one set of scores from another set 2) The general equation for a straight line is expressed as A) Y - X- B)...
 # Part 3) PRICE 'ELASTICITY' (8 points) You are a financial manager for a unit within a textile company that specializes in zippers, buttons and other fasteners. Your area Vice President gives you the last 16 weeks of sales data for a recently launched product, the Elastiband 2.0 (units sold are in thousands). She asks you to analyze the data and provide a reliable sales forecast for the next four weeks. For your convenience, this data is provided in an...
 PART 2 PURPOSE The purpose of this the skill to estimate a demand function using statistical software and interpret the findings. assignment is to provide the student with REQUIREMENT Household Manufacturing has collected the following data on quantity sold (Q). price (P), income (I), and advertising (A). Period Quantity, Q Price, P Income, Advertising, A 120 165 120 165 180 8.0 4.0 7.0 4.0 10.0 4.0 19 18 25 150 190 160 10.2 9.3 5.0 10 35 9.5 a Use...
 Chapter 12 Project: Linear Regression and Correlation Student Learning Outcomes: • The student will calculate and construct the line of best fit between two variables. • The student will evaluate the relationship between two variables to determine if that relationship is significant Data The table below gives total fuel efficiency (in miles per gallon) and mass (in kilograms) of 20 new model cars with automatic transmissions. We will use this data to determine the relationship, if any, between the fuel...
 part 1 is done need help with part 2 please
Regression and Correlation Part 1 -Hypothesis test for u a) Use the data provided Perform a complete hypothesis test (show all steps) of Ho: 4 = 42 Use a -.05 Word your conclusion clearly in plain English so that a 14-year-old would understand it. For this part of the assignment, we'll look to see if there's an association between the responses of your two numerical questions PART 2 - Regression...
part 1 is done need help with part 2 please
Regression and Correlation Part 1 -Hypothesis test for u a) Use the data provided Perform a complete hypothesis test (show all steps) of Ho: 4 = 42 Use a -.05 Word your conclusion clearly in plain English so that a 14-year-old would understand it. For this part of the assignment, we'll look to see if there's an association between the responses of your two numerical questions PART 2 - Regression...
Most questions answered within 3 hours.
-
Calculate the volume integral of the function T=z^2 over the
tetrahedron with corners (0,0,0), (1,0,0), (0,1,0),...
asked 47 minutes ago -
I propose to you a game. You roll 2 dice. If the sum of the
numbers...
asked 1 hour ago -
Select the most likely lattice types for each of the following
salts: (a) BeF2; (b) CaO;...
asked 1 hour ago -
a
ball is thrown downward with velocity of 10m/s. calculate the final
velocity if it reaches...
asked 2 hours ago -
How many grams of ice at -15°C must be added to 705 grams of
water that...
asked 3 hours ago -
2. Balance sheet
The balance sheet provides a snapshot of the financial condition
of a company....
asked 4 hours ago -
In week 1 of the chemical equilibrium experiment, you and your
lab team will create a...
asked 4 hours ago -
Identify and describe five (5) characteristics of a good KM
measurement system. Be sure to include...
asked 4 hours ago -
What are at least five (5) workplace wellness best practices for
a successful wellness program? Explain...
asked 4 hours ago -
A pharmaceutical company is testing a new drug. Of the 110
people that received the drug,...
asked 5 hours ago -
Which of the following is NOT a mechanism for gene
regulation?
a. Phase variation in DNA....
asked 5 hours ago -
Which of the following is being applied when, under certain
conditions, the value recorded for an...
asked 5 hours ago