


Homework Answers
a)
alpha = 0.01
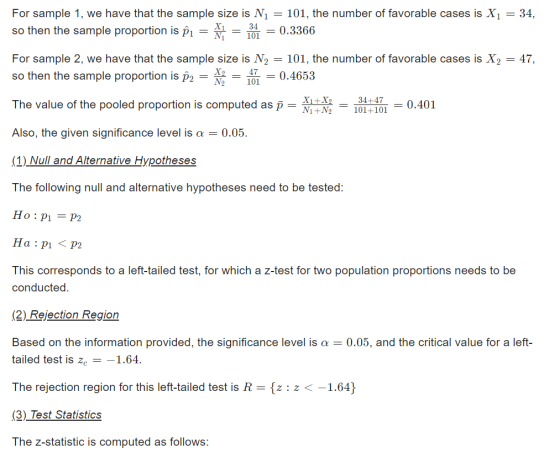
(1) Null and Alternative Hypotheses
The following null and alternative hypotheses need to be tested:
Ho: p1=p2
Ha: p1>p2
b)
The standard normal. The number of trials is sufficiently large.
The standard normal. we assume the population distribution are approximately normal.

test statistic z =−1.866
The p-value is p = 0.031

d)
At alpha = 0.01 level we reject the null hypothesis and conclude the data are not statistically significant.
e)
Reject the null hypothesis, there is sufficient evidence that the proportion of adults that attended college who believe in extraterrestrial is higher than that of adults who did not attend college.
Add Answer to:
Based on information from a previous study, r = 34 people out of a random sample...
Do you prefer paintings in which the people are fully clothed? This question was asked by...
Do you prefer paintings in which the people are fully clothed? This question was asked by a professional survey group on behalf of a national arts organization. A random sample of n1 = 56 people who are conservative voters showed that r1 = 43 said yes. Another random sample of n2 = 65 people who are liberal voters showed that r2 = 37 said yes. Does this indicate that the population proportion of conservative voters who prefer art with fully...
Would you favor spending more federal tax money on the arts? Of a random sample of...
 Would you favor spending more federal tax money on the arts? Of a random sample of n = 93 politically conservative voters, 1 = 17 responded yes. Another random sample of n2 = 78 politically moderate voters showed that r2 - 22 responded yes. Does this information indicate that the population proportion of conservative voters inclined to spend more federal tax money on funding the arts is less than the proportion of moderate voters so inclined? Use a = 0.05....
For one binomial experiment, n1 = 75 binomial trials produced r1 = 60 successes. For a...
For one binomial experiment, n1 = 75 binomial trials produced r1 = 60 successes. For a second independent binomial experiment, n2 = 100 binomial trials produced r2 = 85 successes. At the 5% level of significance, test the claim that the probabilities of success for the two binomial experiments differ. (a) Compute the pooled probability of success for the two experiments. (Round your answer to three decimal places.) (b) Check Requirements: What distribution does the sample test statistic follow? Explain....
A random sample of leading companies in South Korea gave the following percentage yields based on...
A random sample of leading companies in South Korea gave the following percentage yields based on assets. 2.1 2.3 4.2 1.9 0.5 3.6 2.4 0.2 1.7 1.8 1.4 5.4 1.1 Use a calculator to verify that s2 ≈ 2.125 for these South Korean companies. Another random sample of leading companies in Sweden gave the following percentage yields based on assets. 2.2 3.8 3.9 1.1 3.9 2.8 2.3 3.5 2.8 Use a calculator to verify that s2 ≈ 0.909 for these...
A random sample of 16 values is drawn from a mound-shaped and symmetric distribution. The sample...
A random sample of 16 values is drawn from a mound-shaped and symmetric distribution. The sample mean is 9 and the sample standard deviation is 2. Use a level of significance of 0.05 to conduct a two-tailed test of the claim that the population mean is 8.5. (a) Is it appropriate to use a Student's t distribution? Explain. Yes, because the x distribution is mound-shaped and symmetric and σ is unknown. No, the x distribution is skewed left. No, the...
A random sample of 16 values is drawn from a mound-shaped and symmetric distribution. The sample...
A random sample of 16 values is drawn from a mound-shaped and symmetric distribution. The sample mean is 15 and the sample standard deviation is 2. Use a level of significance of 0.05 to conduct a two-tailed test of the claim that the population mean is 14.5. (a) Is it appropriate to use a Student's t distribution? Explain. Yes, because the x distribution is mound-shaped and symmetric and σ is unknown.No, the x distribution is skewed left. No, the x distribution...
What is your favorite color? A large survey of countries, including the United States, China, Russia,...
 What is your favorite color? A large survey of countries,
including the United States, China, Russia, France, Turkey, Kenya,
and others, indicated that most people prefer the color blue. In
fact, about 24% of the population claim blue as their favorite
color.† Suppose a random sample of n = 54 college students
were surveyed and r = 10 of them said that blue is their
favorite color. Does this information imply that the color
preference of all college students is...
What is your favorite color? A large survey of countries,
including the United States, China, Russia, France, Turkey, Kenya,
and others, indicated that most people prefer the color blue. In
fact, about 24% of the population claim blue as their favorite
color.† Suppose a random sample of n = 54 college students
were surveyed and r = 10 of them said that blue is their
favorite color. Does this information imply that the color
preference of all college students is...
A random sample of n = 10 regions in New England gave the following violent crime...
 A random sample of n = 10 regions in New England gave the following violent crime rates (per million population). x New England Crime Rate 3.3 3.7 4.2 3.9 3.3 4.1 1.8 4.8 2.9 3.1 Another random sample of n = 12 regions in the Rocky Mountain states gave the following violent crime rates (per million population). x, Rocky Mountain Crime Rate 3.7 4.1 4.7 5.1 3.3 4.8 3.5 2.4 3.1 3.5 5.2 2.8 Assume that the crime rate distribution...
Only 18% of registered voters voted in the last election. Will voter participation increase for the...
Only 18% of registered voters voted in the last election. Will voter participation increase for the upcoming election? Of the 352 randomly selected registered voters surveyed, 77 of them will vote in the upcoming election. What can be concluded at the α= 0.05 level of significance? For this study, we should use Select an answer t-test for a population mean or z-test for a population proportion The null and alternative hypotheses would be: H0:? μ p Select an answer ≠...
The average annual miles driven per vehicle in the United States is 11.1 thousand miles, with...
The average annual miles driven per vehicle in the United States is 11.1 thousand miles, with σ ≈ 600 miles. Suppose that a random sample of 41 vehicles owned by residents of Chicago showed that the average mileage driven last year was 10.9 thousand miles. Does this indicate that the average miles driven per vehicle in Chicago is different from (higher or lower than) the national average? Use a 0.05 level of significance. What are we testing in this problem?...
 Would you favor spending more federal tax money on the arts? Of a random sample of n = 93 politically conservative voters, 1 = 17 responded yes. Another random sample of n2 = 78 politically moderate voters showed that r2 - 22 responded yes. Does this information indicate that the population proportion of conservative voters inclined to spend more federal tax money on funding the arts is less than the proportion of moderate voters so inclined? Use a = 0.05....
 What is your favorite color? A large survey of countries,
including the United States, China, Russia, France, Turkey, Kenya,
and others, indicated that most people prefer the color blue. In
fact, about 24% of the population claim blue as their favorite
color.† Suppose a random sample of n = 54 college students
were surveyed and r = 10 of them said that blue is their
favorite color. Does this information imply that the color
preference of all college students is...
What is your favorite color? A large survey of countries,
including the United States, China, Russia, France, Turkey, Kenya,
and others, indicated that most people prefer the color blue. In
fact, about 24% of the population claim blue as their favorite
color.† Suppose a random sample of n = 54 college students
were surveyed and r = 10 of them said that blue is their
favorite color. Does this information imply that the color
preference of all college students is...
 A random sample of n = 10 regions in New England gave the following violent crime rates (per million population). x New England Crime Rate 3.3 3.7 4.2 3.9 3.3 4.1 1.8 4.8 2.9 3.1 Another random sample of n = 12 regions in the Rocky Mountain states gave the following violent crime rates (per million population). x, Rocky Mountain Crime Rate 3.7 4.1 4.7 5.1 3.3 4.8 3.5 2.4 3.1 3.5 5.2 2.8 Assume that the crime rate distribution...
Most questions answered within 3 hours.
-
The blues made its way into many kinds of music. Eric Clapton,
The Beatles, and Elvis...
asked 22 minutes ago -
If you’re standing at the bottom of a hill and asked to evaluate
it while being...
asked 1 hour ago -
1. Which region has taken the lead in the world of
e-waste handling?
a) European Union...
asked 1 hour ago -
A 8.15- g bullet from a 9-mm pistol has a velocity of 366.0 m/s.
It strikes...
asked 2 hours ago -
The outstanding bonds of Alpha Extracts have a yield to maturity
of 7.4 percent and a...
asked 2 hours ago -
The Problem: The Case of the Harmonizing Vacations
Your CEO is exploring partnering with a European...
asked 4 hours ago -
A chemical equation is balanced by adding coefficients in front
of some formulas so that the...
asked 4 hours ago -
From the literature (reference your sources): What are the
lattice parameters of calcite and aragonite? Why...
asked 4 hours ago -
Your system is rejecting the question am asking which is
preceded by a case study. It...
asked 4 hours ago -
3. On January 2, 2000, Larry creates a trust with himself as
trustee. Larry as trustee...
asked 4 hours ago -
A member of the volleyball team spikes the ball. During this
process, she changes the velocity...
asked 4 hours ago -
Are adult gamers less likely to use a gaming console (Xbox,
PlayStation, Wii, etc...) than teen...
asked 5 hours ago