
Homework Answers


Interpretation:
The frequency histogram illustrated about the data distribution, which is skewed to the right indicates that the mean is greater than the median of the data distribution. The frequency distribution of the trading days is skewed to the right.
-------------------------------------------------------------------------------------------------------------------------------

Interpretation:
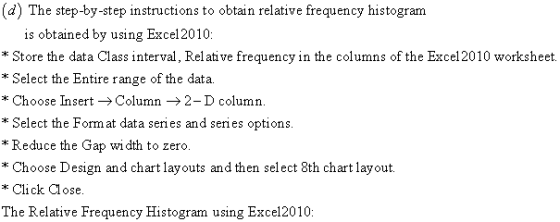
The relative frequency histogram illustrated about the data distribution, which is skewed to the right indicates about the mean is greater than the median of the data distribution. The frequency distribution of the volume of trading days is right skewed.
Add Answer to:
Volume of Altria Group Stock The volume of a stock is the number of shares traded...
Q1) Twenty six smokers were surveyed to ascertain the number of cigarettes each smoked for a 1 we...
 please answer 1 and 2 in detail
Q1) Twenty six smokers were surveyed to ascertain the number of cigarettes each smoked for a 1 weelk period. The results are as follows: 44 39 37 21 31 28 44 29 30 52 40 20 24 32 22 27 50 43 26 37 26 51 34 27 33 25 Create a frequency distribution with 5 classes using the headings: #ofcigarettes. Frequency(), Cumulative Frequency (c), and relative frequency (r). Show details of your...
please answer 1 and 2 in detail
Q1) Twenty six smokers were surveyed to ascertain the number of cigarettes each smoked for a 1 weelk period. The results are as follows: 44 39 37 21 31 28 44 29 30 52 40 20 24 32 22 27 50 43 26 37 26 51 34 27 33 25 Create a frequency distribution with 5 classes using the headings: #ofcigarettes. Frequency(), Cumulative Frequency (c), and relative frequency (r). Show details of your...
2. The following data show the number of cars that arrived at a Tim-Hortons drive-through between...
2. The following data show the number of cars that arrived at a Tim-Hortons drive-through between 10:00 AM and 11:00 AM each Monday for the past 50 weeks: 1 6 5 4 2 7 5 3 4 5 3 6 6 9 6 8 4 3 3 1 2 3 3 5 7 3 4 4 2 1 8 3 3 3 5 2 8 2 5 3 6 1 1 5 8 3 2 2 5 4 (a) Construct...
 please answer 1 and 2 in detail
Q1) Twenty six smokers were surveyed to ascertain the number of cigarettes each smoked for a 1 weelk period. The results are as follows: 44 39 37 21 31 28 44 29 30 52 40 20 24 32 22 27 50 43 26 37 26 51 34 27 33 25 Create a frequency distribution with 5 classes using the headings: #ofcigarettes. Frequency(), Cumulative Frequency (c), and relative frequency (r). Show details of your...
please answer 1 and 2 in detail
Q1) Twenty six smokers were surveyed to ascertain the number of cigarettes each smoked for a 1 weelk period. The results are as follows: 44 39 37 21 31 28 44 29 30 52 40 20 24 32 22 27 50 43 26 37 26 51 34 27 33 25 Create a frequency distribution with 5 classes using the headings: #ofcigarettes. Frequency(), Cumulative Frequency (c), and relative frequency (r). Show details of your...
Most questions answered within 3 hours.
-
can someone please write the balanced chemical
equation for the synthesis of Bromoacetanilide
from;
aniline +...
asked 1 minute ago -
(Ratio Analysis): Last year Co. XYZ had sales of $ 400,000, with
“cost of goods sold”...
asked 5 minutes ago -
1. If a corporation purchases land and building and subsequently
tears down the building and uses...
asked 12 minutes ago -
Consider a 23-year bond with 7 percent annual coupon payments.
The market rate (YTM) is 6.4...
asked 15 minutes ago -
a tuba creates a 4th harmonic of frequency 116.5 Hz. what is the
frequency of the...
asked 21 minutes ago -
A coconut mass 2kg falls from a 30m tall tree. The coconut falls
and comes to...
asked 24 minutes ago -
Group Policies
Research GROUP POLICY OBJECTS (GPO'S)
You can start in the Windows Server 2012 eBook...
asked 28 minutes ago -
software engineering
Problems.
Create a use case diagram for class registration for a
university.
Create a...
asked 28 minutes ago -
You are trying to convince your friend who wants to attend
medical school to take BY123...
asked 43 minutes ago -
Subject: C++
I have created a class called QueueOfIntegers in a file called
QueueOfIntegers.h, which is...
asked 43 minutes ago -
calculate the number of molecules of gas in a
container of 2.0 liter at 30 degrees...
asked 1 hour ago -
1.which of the following is a phototroph?
a. sulfolobus
b. chloroflexus
c. bacteroidetes
d. deinococcus radioduran...
asked 56 minutes ago