
Homework Answers
The required MATLAB CODE is as follows:
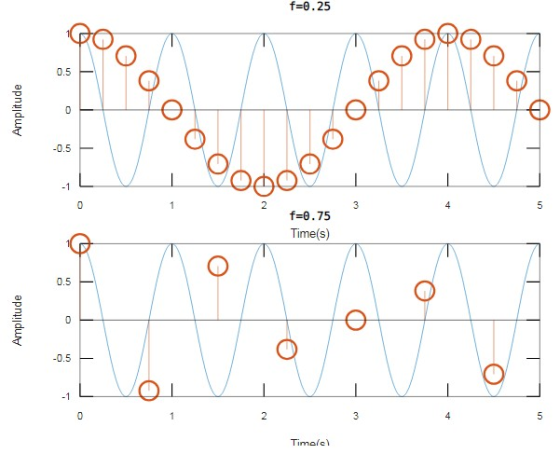
fs=0.01; %Very high sampling rate
f=1; %Frequency of sinusoid
nCyl=5; %generate five cycles of sinusoid
maxf=nCyl*f;
t=0:fs:maxf; %time index
x=cos(2*pi*f*t); % continious wave
fs1=0.25; %1/0.25 sampling rate
t1=0:fs1:maxf; %time index
x1=cos(2*pi*fs1*t1);
fs2=0.75; % 1/0.75 sampling rate
t2=0:fs2:maxf; %time index
x2=cos(2*pi*fs2*t2);
figure
subplot(2,1,1);
plot(t,x);
hold on;
stem(t1,x1); % plot the first sample
xlabel('Time(s)');
ylabel('Amplitude')
title('f=0.25');
subplot(2,1,2);
plot(t,x);
hold on;
stem(t2,x2); % plot the first sample
xlabel('Time(s)');
ylabel('Amplitude')
title('f=0.75')
**************************************SAMPLE OUTPUT**********************
Add Answer to:
3 Accuracy of Sampling Let us sample the function gt)cos(2fo) at sampling interval dt- 1, for...
Problem 31: (34 points) 1. (10 points) A pulse width modulated (PWM) signal fPwM(t) in Figure...
 Problem 31: (34 points) 1. (10 points) A pulse width modulated (PWM) signal fPwM(t) in Figure 2. The symbol D represents a duty cycle, a number between zero and one. Determine the compact trigonometric Fourier series coefficients (Co C,11 %) of the signal f(t). 2. (10 points) One use of PWM is to generate variable DC voltages. While the PWM signal is not DC, you should be able to see from your results in part 1 that it hss a...
1. Using the Fourier series analysis Equation 3 for the periodic function r(t) shown in Figure 2....
 1. Using the Fourier series analysis Equation 3 for the periodic function r(t) shown in Figure 2.1, determine both the DC coefficient ao and a general expression for the other Fourier series coefficients ak. Do this by hand, not in Matlab. Show all your work in your lab report. You can add these pages as hand-written pages, rather than typing them in to your lab report, if you prefer Hint 1: It will be easiest to integrate this function from...
 Problem 31: (34 points) 1. (10 points) A pulse width modulated (PWM) signal fPwM(t) in Figure 2. The symbol D represents a duty cycle, a number between zero and one. Determine the compact trigonometric Fourier series coefficients (Co C,11 %) of the signal f(t). 2. (10 points) One use of PWM is to generate variable DC voltages. While the PWM signal is not DC, you should be able to see from your results in part 1 that it hss a...
 1. Using the Fourier series analysis Equation 3 for the periodic function r(t) shown in Figure 2.1, determine both the DC coefficient ao and a general expression for the other Fourier series coefficients ak. Do this by hand, not in Matlab. Show all your work in your lab report. You can add these pages as hand-written pages, rather than typing them in to your lab report, if you prefer Hint 1: It will be easiest to integrate this function from...
Most questions answered within 3 hours.
-
1-Write an algorithm to get two numbers from the user (as
inputs) and calculate the sum...
asked 1 hour ago -
Define white-collar crime. What is the difference between
offender and offense-based definitions of white-collar crime? What...
asked 1 hour ago -
Consider a reaction which is 1st order with respect to A and 1st
order with respect...
asked 1 hour ago -
c++
The length of the hypotenuse of a right-angled triangle is the
square root of the...
asked 1 hour ago -
When a metal rod is heated, not only its resistance but also its
length and cross‐sectional...
asked 2 hours ago -
write a c++ program that computes the L^1 - Norm of a given
vector (L^1 norm...
asked 2 hours ago -
A manufacturer of banana chips would like to know whether its
bag filling machine works correctly...
asked 2 hours ago -
Complete the chapter case, "Turnover Analysis".
Chapter Case
Turnover Analysis
You recently completed your company’s new...
asked 2 hours ago -
What is the pH of solutions having the following H3O+
concentrations? Identify each as acidic, basic,...
asked 2 hours ago -
How does over-voltage of the diode usually occur?
asked 2 hours ago -
If you step on a dirty nail, your doctor will recommend you
update your Tetanus vaccination....
asked 2 hours ago -
Suppose that decreases in the price of milk lead to decrease s
in the retail prices...
asked 2 hours ago