Selected balance sheet, income statement and cash flow statement information from Tesla, Inc. for 2017 and...
Selected balance sheet, income statement and cash flow statement information from Tesla, Inc. for 2017 and 2016 follows ($ thousands).
| December 31 | 2017 | 2016 |
|---|---|---|
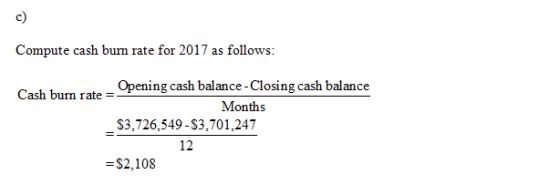
| Cash and cash equivalents | $3,701,247 | $3,726,549 |
| Restricted cash | 156,545 | 106,741 |
| Net receivables | 515,381 | 499,142 |
| Inventory | 2,263,537 | 2,067,454 |
| Other current assets | 268,365 | 194,465 |
| Current assets | 6,905,075 | 6,594,351 |
| Current liabilities | 7,674,670 | 5,827,005 |
| Total liabilities | 23,022,980 | 16,750,167 |
| Stockholders' equity | 5,965,725 | 6,247,242 |
| Year ended December 31, | 2017 |
|---|---|
| Loss before income taxes | $(2,209,032) |
| Interest expense | 504,592 |
| Cash flows from operating activities | (59,432) |
| Capital expenditures | (3,748,147) |
a. Compute the current ratio and quick ratio for each year.
Note: Round answers to two decimal places.
| 2017 | 2016 | |
|---|---|---|
| Current ratio | Answer | Answer |
| Quick ratio | Answer | Answer |
b. Compute the debt-to-equity ratio for 2017 and 2016 and the times-interest-earned ratio for 2017.
Note: Round answers to two decimal places. Use a negative sign with your answer, if appropriate.
| 2017 | 2016 | |
|---|---|---|
| Debt-to-equity ratio | Answer | Answer |
| Times interest earned ratio | Answer |
c. Compute the cash burn rate for 2017.
Note: Round answer to the nearest whole number. Use a negative sign with your answer, if appropriate.
$Answer
thousand per day
Homework Answers


Add Answer to:
Selected balance sheet, income statement and cash flow statement
information from Tesla, Inc. for 2017 and...
Selected balance sheet, income statement and cash flow statement information from Tesla, Inc. for 2017 and...
 Selected balance sheet, income
statement and cash flow statement information from Tesla, Inc. for
2017 and 2016 follows ($ thousands). December 31 2017 2016 Cash and
cash equivalents $4,034,580 $4,059,882 Restricted cash 159,878
110,074 Net receivables 515,381 499,142 Inventory 2,263,537
2,067,454 Other current assets 268,365 194,465 Current assets
6,570,520 6,259,796 Current liabilities 7,241,741 6,931,017 Total
liabilities 23,022,980 16,750,167 Stockholders' equity 6,299,058
6,580,575 Year ended December 31, 2017 Loss before income taxes
$(2,209,032) Interest expense 537,925 Cash flows from operating
activities...
Selected balance sheet, income
statement and cash flow statement information from Tesla, Inc. for
2017 and 2016 follows ($ thousands). December 31 2017 2016 Cash and
cash equivalents $4,034,580 $4,059,882 Restricted cash 159,878
110,074 Net receivables 515,381 499,142 Inventory 2,263,537
2,067,454 Other current assets 268,365 194,465 Current assets
6,570,520 6,259,796 Current liabilities 7,241,741 6,931,017 Total
liabilities 23,022,980 16,750,167 Stockholders' equity 6,299,058
6,580,575 Year ended December 31, 2017 Loss before income taxes
$(2,209,032) Interest expense 537,925 Cash flows from operating
activities...
Compute and Interpret Liquidity and Solvency Ratios Selected balance sheet, income statement and cash flow statement...
Compute and Interpret Liquidity and Solvency Ratios Selected balance sheet, income statement and cash flow statement information from Tesla, Inc. for 2017 and 2016 follows ($ thousands). December 31 2017 2016 Cash and cash equivalents $4,145,691 $4,170,993 Restricted cash 160,989 111,185 Net receivables 515,381 499,142 Inventory 2,263,537 2,067,454 Other current assets 268,365 194,465 Current assets 7,353,963 7,043,239 Current liabilities 7,674,670 5,827,005 Total liabilities 23,022,980 16,750,167 Stockholders' equity 6,410,169 6,691,686 Year ended December 31, 2017 Loss before income taxes $(2,209,032) Interest...
Compute and Interpret Liquidity and Solvency Ratios Selected balance sheet, income statement and cash flow statement...
Compute and Interpret Liquidity and Solvency Ratios Selected balance sheet, income statement and cash flow statement information from Tesla, Inc. for 2017 and 2016 follows ($ thousands). December 31 2017 2016 Cash and cash equivalents $3,701,247 $3,726,549 Restricted cash 156,545 106,741 Net receivables 515,381 499,142 Inventory 2,263,537 2,067,454 Other current assets 268,365 194,465 Current assets 6,905,075 6,594,351 Current liabilities 7,674,670 5,827,005 Total liabilities 23,022,980 16,750,167 Stockholders' equity 5,965,725 6,247,242 Year ended December 31, 2017 Loss before income taxes $(2,209,032) Interest...
Need help with what I got wrong, please. December 31 2017 2016 Cash and cash equivalents...
 Need help with what I got wrong, please.
December 31 2017 2016 Cash and cash equivalents $3,367,914 $3,393,216 Restricted cash 155,323 105,519 ws Net receivables Nec receivab 515,381 499,142 Inventory 2,263,537 2,067,454 40. Other current assets 268,365 194,465 Current assets 6,570,520 6,259,796 Current liabilities 7,674,670 5,827,005 Total liabilities 23,022,880 16,750,162 Stockholders' equity 5,632.392 5,913,909 Year ended December 31, 2017 Lass before income taxes $12,209,032) Interest expense 471,259 Cash flows from operating activities (60,654) Capital expenditures (3,414,814) Support a. Compute the...
Need help with what I got wrong, please.
December 31 2017 2016 Cash and cash equivalents $3,367,914 $3,393,216 Restricted cash 155,323 105,519 ws Net receivables Nec receivab 515,381 499,142 Inventory 2,263,537 2,067,454 40. Other current assets 268,365 194,465 Current assets 6,570,520 6,259,796 Current liabilities 7,674,670 5,827,005 Total liabilities 23,022,880 16,750,162 Stockholders' equity 5,632.392 5,913,909 Year ended December 31, 2017 Lass before income taxes $12,209,032) Interest expense 471,259 Cash flows from operating activities (60,654) Capital expenditures (3,414,814) Support a. Compute the...
Compute and Interpret Liquidity and Solvency Ratios Selected balance sheet, income statement and cash flow statement...
 Compute and Interpret Liquidity and Solvency Ratios Selected balance sheet, income statement and cash flow statement information from Tesla, Inc. for 2017 and 2016 follows (s thousan December 31 2017 2016 Cash and cash equivalents $3.367,914 53.393.216 Restricted cash 155,323 105,519 Net receivables 515.381 499,142 Inventory 2,263,537 2,067.454 Other current assets 268.365 194,465 Current assets 6,570,520 6,259,796 Current liabilities 7,674,670 5.827,005 Total liabilities 23,022.980 16.750.167 Stockholders' equity 5,632.392 5.913.909 Year ended December 31, 2017 Loss before income taxes 512,209,032) Interest...
Compute and Interpret ROA, Profit Margin, and Asset Turnover of Competitors Selected balance sheet and income...
Compute and Interpret ROA, Profit Margin, and Asset Turnover of Competitors Selected balance sheet and income statement information for McDonald's Corporation and Yum! Brands, Inc., follows (in millions). Sales Revenue Interest Expense Net Income Average Total Assets McDonalds $32,853 $671 $5,758 $46,995 Yum! Brands 15,031 180 1,196 10,375 a. Compute the return on assets (ROA) for each company. Assume a tax rate of 35%. Do not round until your final answer. Round answer to one decimal place (i.e., 0.2568 =...
Compute and Interpret Coverage, Liquidity and Solvency Ratios Selected balance sheet and income statement information from...
 Compute and Interpret Coverage, Liquidity and Solvency Ratios Selected balance sheet and income statement information from Amazon for 2016 through 2018 follows. $ millions 2018 2017 2016 Net operating profit after tax (NOPAT) $10,978 $3,222 $2,556 Net income 10,073 3,033 2,371 Operating profit 12,421 4,106 4,186 Interest expense 1,417 848 484 Cash from operating activities 30,723 18,365 17,203 Current assets 75,101 60,197 45,781 Current liabilities 68,391 57,883 43,816 Cash and cash equivalents 31,750 20,522 19,334 Marketable securities 9,500 10,464 6,647...
Selected balance sheet and income statement information from Amazon for 2016 through 2018 follows. $ millions...
 Selected balance sheet and income statement information from Amazon for 2016 through 2018 follows. $ millions 2018 2017 2016 Net operating profit after tax (NOPAT) $11,307 $3,319 $2,633 Net income 10,375 3,124 2,442 Operating profit 12,794 4,229 4,312 Interest expense 1,332 797 455 Cash from operating activities 31,645 18,916 17,719 Current assets 77,354 62,003 47,154 Current liabilities 64,288 54,410 41,187 Cash and cash equivalents 32,703 21,138 19,914 Marketable securities 9,785 10,778 6,846 Total debt 22,085 23,258 7,232 Assets 167,527 135,249...
Compute and Interpret Liquidity, Solvency and Coverage Ratios Selected balance sheet and income statement information for...
 Compute and Interpret Liquidity, Solvency and Coverage Ratios Selected balance sheet and income statement information for Starbucks for 2018 and 2017 follows. ($ millions) Cash 2018 2017 $ 8,756.3 $2,462.3 181.5 228.6 Short-term investments Accounts receivable 693.1 870.4 Current assets 12,494.2 5,283.4 5,684.2 4,220.7 349.9 Current liabilities Short-term debt Long-term debt Total liabilities Interest expense Capital expenditures Equity Cash from operations Earnings before interest and taxes 9,090.2 3,932.6 22,980.6 8,908.6 170.3 92.5 1,976.4 1,519.4 1,175.8 5,457.0 11,937.8 4,251.8 3,883.3 4,134.7...
Compute and Interpret Liquidity, Solvency and Coverage Ratios Selected balance sheet and income statement information for...
Compute and Interpret Liquidity, Solvency and Coverage Ratios Selected balance sheet and income statement information for Calpine Corporation for 2004 and 2006 follows. ($ millions) 2004 2006 Cash $ 1,256.73 $ 1,523.36 Accounts receivable 1,097.16 735.30 Current assets 3,313.56 3,268.33 Current liabilities 3,285.39 6,057.95 Long-term debt 17,150.81 3,531.63 Short-term debt 1,033.96 4,568.83 Total liabilities 22,898.42 25,503.17 Interest expense 1,516.90 1,288.29 Capital expenditures 1,545.48 211.50 Equity 4,587.67 (7,152.90) Cash from operations 19.89 335.98 Earnings before interest and taxes 1,659.84 1,907.84 (a)...
 Selected balance sheet, income
statement and cash flow statement information from Tesla, Inc. for
2017 and 2016 follows ($ thousands). December 31 2017 2016 Cash and
cash equivalents $4,034,580 $4,059,882 Restricted cash 159,878
110,074 Net receivables 515,381 499,142 Inventory 2,263,537
2,067,454 Other current assets 268,365 194,465 Current assets
6,570,520 6,259,796 Current liabilities 7,241,741 6,931,017 Total
liabilities 23,022,980 16,750,167 Stockholders' equity 6,299,058
6,580,575 Year ended December 31, 2017 Loss before income taxes
$(2,209,032) Interest expense 537,925 Cash flows from operating
activities...
Selected balance sheet, income
statement and cash flow statement information from Tesla, Inc. for
2017 and 2016 follows ($ thousands). December 31 2017 2016 Cash and
cash equivalents $4,034,580 $4,059,882 Restricted cash 159,878
110,074 Net receivables 515,381 499,142 Inventory 2,263,537
2,067,454 Other current assets 268,365 194,465 Current assets
6,570,520 6,259,796 Current liabilities 7,241,741 6,931,017 Total
liabilities 23,022,980 16,750,167 Stockholders' equity 6,299,058
6,580,575 Year ended December 31, 2017 Loss before income taxes
$(2,209,032) Interest expense 537,925 Cash flows from operating
activities...
 Need help with what I got wrong, please.
December 31 2017 2016 Cash and cash equivalents $3,367,914 $3,393,216 Restricted cash 155,323 105,519 ws Net receivables Nec receivab 515,381 499,142 Inventory 2,263,537 2,067,454 40. Other current assets 268,365 194,465 Current assets 6,570,520 6,259,796 Current liabilities 7,674,670 5,827,005 Total liabilities 23,022,880 16,750,162 Stockholders' equity 5,632.392 5,913,909 Year ended December 31, 2017 Lass before income taxes $12,209,032) Interest expense 471,259 Cash flows from operating activities (60,654) Capital expenditures (3,414,814) Support a. Compute the...
Need help with what I got wrong, please.
December 31 2017 2016 Cash and cash equivalents $3,367,914 $3,393,216 Restricted cash 155,323 105,519 ws Net receivables Nec receivab 515,381 499,142 Inventory 2,263,537 2,067,454 40. Other current assets 268,365 194,465 Current assets 6,570,520 6,259,796 Current liabilities 7,674,670 5,827,005 Total liabilities 23,022,880 16,750,162 Stockholders' equity 5,632.392 5,913,909 Year ended December 31, 2017 Lass before income taxes $12,209,032) Interest expense 471,259 Cash flows from operating activities (60,654) Capital expenditures (3,414,814) Support a. Compute the...
 Compute and Interpret Liquidity and Solvency Ratios Selected balance sheet, income statement and cash flow statement information from Tesla, Inc. for 2017 and 2016 follows (s thousan December 31 2017 2016 Cash and cash equivalents $3.367,914 53.393.216 Restricted cash 155,323 105,519 Net receivables 515.381 499,142 Inventory 2,263,537 2,067.454 Other current assets 268.365 194,465 Current assets 6,570,520 6,259,796 Current liabilities 7,674,670 5.827,005 Total liabilities 23,022.980 16.750.167 Stockholders' equity 5,632.392 5.913.909 Year ended December 31, 2017 Loss before income taxes 512,209,032) Interest...
 Compute and Interpret Coverage, Liquidity and Solvency Ratios Selected balance sheet and income statement information from Amazon for 2016 through 2018 follows. $ millions 2018 2017 2016 Net operating profit after tax (NOPAT) $10,978 $3,222 $2,556 Net income 10,073 3,033 2,371 Operating profit 12,421 4,106 4,186 Interest expense 1,417 848 484 Cash from operating activities 30,723 18,365 17,203 Current assets 75,101 60,197 45,781 Current liabilities 68,391 57,883 43,816 Cash and cash equivalents 31,750 20,522 19,334 Marketable securities 9,500 10,464 6,647...
 Selected balance sheet and income statement information from Amazon for 2016 through 2018 follows. $ millions 2018 2017 2016 Net operating profit after tax (NOPAT) $11,307 $3,319 $2,633 Net income 10,375 3,124 2,442 Operating profit 12,794 4,229 4,312 Interest expense 1,332 797 455 Cash from operating activities 31,645 18,916 17,719 Current assets 77,354 62,003 47,154 Current liabilities 64,288 54,410 41,187 Cash and cash equivalents 32,703 21,138 19,914 Marketable securities 9,785 10,778 6,846 Total debt 22,085 23,258 7,232 Assets 167,527 135,249...
 Compute and Interpret Liquidity, Solvency and Coverage Ratios Selected balance sheet and income statement information for Starbucks for 2018 and 2017 follows. ($ millions) Cash 2018 2017 $ 8,756.3 $2,462.3 181.5 228.6 Short-term investments Accounts receivable 693.1 870.4 Current assets 12,494.2 5,283.4 5,684.2 4,220.7 349.9 Current liabilities Short-term debt Long-term debt Total liabilities Interest expense Capital expenditures Equity Cash from operations Earnings before interest and taxes 9,090.2 3,932.6 22,980.6 8,908.6 170.3 92.5 1,976.4 1,519.4 1,175.8 5,457.0 11,937.8 4,251.8 3,883.3 4,134.7...
Most questions answered within 3 hours.
-
Cisco packet tracer
Q1) Do you get any changes of IP address when packet is
traversing...
asked 47 seconds ago -
What is the pressure inside a 33.0 L container holding 106.4 kg
of argon gas at...
asked 49 minutes ago -
Question no 2
A housekeeping support department budgets its costs at
SR 40,000 per month plus...
asked 46 minutes ago -
A 1400Kg sports car accelerates from rest to 90km/h in 7.0s.
What is the average power...
asked 1 hour ago -
For the following reaction, 0.128 moles of
potassium hydrogen sulfateare mixed with
0.504 moles of potassium...
asked 5 hours ago -
1. What is the present value of $400, three years in the future
if the interest...
asked 5 hours ago -
The labor force minus the number of employed equals the number
of unemployed.
a. True
b....
asked 7 hours ago -
Determine the mass in units of grams [g] of 0.49 moles [mol]
of a new fictitious...
asked 8 hours ago -
A horizontal mass of M=5kg is on a spring and stretched to
x=0.5m when released from...
asked 9 hours ago -
26 of 50
"I have worked at the Arizona Humane Society for ten years, and
have...
asked 9 hours ago -
Compare and contrast zero based budgeting and incremental (or
base year) budgeting.
asked 9 hours ago -
4 pts 10. Which of the following hypothesis would be MOST
difficult to test experimentally? Group...
asked 9 hours ago