
Homework Answers


Current Ratio
2017- 0.806
2016 - 1.07
Quick Ratio
2017 - 0.63
2016 - 0.70
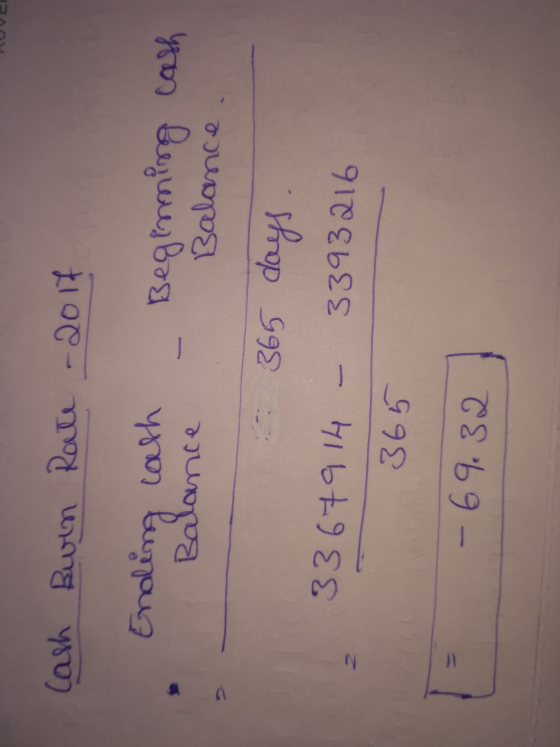
Cash burn rate -2017
-69.32
Add Answer to:
Compute and Interpret Liquidity and Solvency Ratios Selected balance sheet, income statement and cash flow statement...
Compute and Interpret Liquidity and Solvency Ratios Selected balance sheet, income statement and cash flow statement...
Compute and Interpret Liquidity and Solvency Ratios Selected balance sheet, income statement and cash flow statement information from Tesla, Inc. for 2017 and 2016 follows ($ thousands). December 31 2017 2016 Cash and cash equivalents $4,145,691 $4,170,993 Restricted cash 160,989 111,185 Net receivables 515,381 499,142 Inventory 2,263,537 2,067,454 Other current assets 268,365 194,465 Current assets 7,353,963 7,043,239 Current liabilities 7,674,670 5,827,005 Total liabilities 23,022,980 16,750,167 Stockholders' equity 6,410,169 6,691,686 Year ended December 31, 2017 Loss before income taxes $(2,209,032) Interest...
Compute and Interpret Liquidity and Solvency Ratios Selected balance sheet, income statement and cash flow statement...
Compute and Interpret Liquidity and Solvency Ratios Selected balance sheet, income statement and cash flow statement information from Tesla, Inc. for 2017 and 2016 follows ($ thousands). December 31 2017 2016 Cash and cash equivalents $3,701,247 $3,726,549 Restricted cash 156,545 106,741 Net receivables 515,381 499,142 Inventory 2,263,537 2,067,454 Other current assets 268,365 194,465 Current assets 6,905,075 6,594,351 Current liabilities 7,674,670 5,827,005 Total liabilities 23,022,980 16,750,167 Stockholders' equity 5,965,725 6,247,242 Year ended December 31, 2017 Loss before income taxes $(2,209,032) Interest...
Selected balance sheet, income statement and cash flow statement information from Tesla, Inc. for 2017 and...
 Selected balance sheet, income
statement and cash flow statement information from Tesla, Inc. for
2017 and 2016 follows ($ thousands). December 31 2017 2016 Cash and
cash equivalents $4,034,580 $4,059,882 Restricted cash 159,878
110,074 Net receivables 515,381 499,142 Inventory 2,263,537
2,067,454 Other current assets 268,365 194,465 Current assets
6,570,520 6,259,796 Current liabilities 7,241,741 6,931,017 Total
liabilities 23,022,980 16,750,167 Stockholders' equity 6,299,058
6,580,575 Year ended December 31, 2017 Loss before income taxes
$(2,209,032) Interest expense 537,925 Cash flows from operating
activities...
Selected balance sheet, income
statement and cash flow statement information from Tesla, Inc. for
2017 and 2016 follows ($ thousands). December 31 2017 2016 Cash and
cash equivalents $4,034,580 $4,059,882 Restricted cash 159,878
110,074 Net receivables 515,381 499,142 Inventory 2,263,537
2,067,454 Other current assets 268,365 194,465 Current assets
6,570,520 6,259,796 Current liabilities 7,241,741 6,931,017 Total
liabilities 23,022,980 16,750,167 Stockholders' equity 6,299,058
6,580,575 Year ended December 31, 2017 Loss before income taxes
$(2,209,032) Interest expense 537,925 Cash flows from operating
activities...
Selected balance sheet, income statement and cash flow statement information from Tesla, Inc. for 2017 and...
Selected balance sheet, income statement and cash flow statement information from Tesla, Inc. for 2017 and 2016 follows ($ thousands). December 31 2017 2016 Cash and cash equivalents $3,701,247 $3,726,549 Restricted cash 156,545 106,741 Net receivables 515,381 499,142 Inventory 2,263,537 2,067,454 Other current assets 268,365 194,465 Current assets 6,905,075 6,594,351 Current liabilities 7,674,670 5,827,005 Total liabilities 23,022,980 16,750,167 Stockholders' equity 5,965,725 6,247,242 Year ended December 31, 2017 Loss before income taxes $(2,209,032) Interest expense 504,592 Cash flows from operating activities...
Need help with what I got wrong, please. December 31 2017 2016 Cash and cash equivalents...
 Need help with what I got wrong, please.
December 31 2017 2016 Cash and cash equivalents $3,367,914 $3,393,216 Restricted cash 155,323 105,519 ws Net receivables Nec receivab 515,381 499,142 Inventory 2,263,537 2,067,454 40. Other current assets 268,365 194,465 Current assets 6,570,520 6,259,796 Current liabilities 7,674,670 5,827,005 Total liabilities 23,022,880 16,750,162 Stockholders' equity 5,632.392 5,913,909 Year ended December 31, 2017 Lass before income taxes $12,209,032) Interest expense 471,259 Cash flows from operating activities (60,654) Capital expenditures (3,414,814) Support a. Compute the...
Need help with what I got wrong, please.
December 31 2017 2016 Cash and cash equivalents $3,367,914 $3,393,216 Restricted cash 155,323 105,519 ws Net receivables Nec receivab 515,381 499,142 Inventory 2,263,537 2,067,454 40. Other current assets 268,365 194,465 Current assets 6,570,520 6,259,796 Current liabilities 7,674,670 5,827,005 Total liabilities 23,022,880 16,750,162 Stockholders' equity 5,632.392 5,913,909 Year ended December 31, 2017 Lass before income taxes $12,209,032) Interest expense 471,259 Cash flows from operating activities (60,654) Capital expenditures (3,414,814) Support a. Compute the...
Compute and Interpret Coverage, Liquidity and Solvency Ratios Selected balance sheet and income statement information from...
 Compute and Interpret Coverage, Liquidity and Solvency Ratios Selected balance sheet and income statement information from Amazon for 2016 through 2018 follows. $ millions 2018 2017 2016 Net operating profit after tax (NOPAT) $10,978 $3,222 $2,556 Net income 10,073 3,033 2,371 Operating profit 12,421 4,106 4,186 Interest expense 1,417 848 484 Cash from operating activities 30,723 18,365 17,203 Current assets 75,101 60,197 45,781 Current liabilities 68,391 57,883 43,816 Cash and cash equivalents 31,750 20,522 19,334 Marketable securities 9,500 10,464 6,647...
Compute and Interpret Liquidity, Solvency and Coverage Ratios Selected balance sheet and income statement information for...
 Compute and Interpret Liquidity, Solvency and Coverage Ratios Selected balance sheet and income statement information for Starbucks for 2018 and 2017 follows. ($ millions) Cash 2018 2017 $ 8,756.3 $2,462.3 181.5 228.6 Short-term investments Accounts receivable 693.1 870.4 Current assets 12,494.2 5,283.4 5,684.2 4,220.7 349.9 Current liabilities Short-term debt Long-term debt Total liabilities Interest expense Capital expenditures Equity Cash from operations Earnings before interest and taxes 9,090.2 3,932.6 22,980.6 8,908.6 170.3 92.5 1,976.4 1,519.4 1,175.8 5,457.0 11,937.8 4,251.8 3,883.3 4,134.7...
Compute and Interpret Liquidity, Solvency and Coverage Ratios Selected balance sheet and income statement information for...
Compute and Interpret Liquidity, Solvency and Coverage Ratios Selected balance sheet and income statement information for Calpine Corporation for 2004 and 2006 follows. ($ millions) 2004 2006 Cash $ 1,256.73 $ 1,523.36 Accounts receivable 1,097.16 735.30 Current assets 3,313.56 3,268.33 Current liabilities 3,285.39 6,057.95 Long-term debt 17,150.81 3,531.63 Short-term debt 1,033.96 4,568.83 Total liabilities 22,898.42 25,503.17 Interest expense 1,516.90 1,288.29 Capital expenditures 1,545.48 211.50 Equity 4,587.67 (7,152.90) Cash from operations 19.89 335.98 Earnings before interest and taxes 1,659.84 1,907.84 (a)...
Compute and Interpret Liquidity, Solvency and Coverage Ratios Selected balance sheet and income statement information for...
 Compute and Interpret Liquidity, Solvency and Coverage Ratios Selected balance sheet and income statement information for Nordstrom, Inc. for 2016 and 2015 follows. ole ($ millions) 2016 2015 Cash $ 595 $ 827 Accounts receivable 196 2,306 Current assets 3,014 5,224 Current liabilities 2,911 2,800 Long-term debt 2,795 3,123 Short-term debt 10 8 Total liabilities 6,827 6,805 Interest expense 153 156 Capital expenditures 1,082 861 Equity 871 2,440 Cash from operations 2,451 1,220 Earnings before interest and taxes 1,101 1,323...
 Selected balance sheet, income
statement and cash flow statement information from Tesla, Inc. for
2017 and 2016 follows ($ thousands). December 31 2017 2016 Cash and
cash equivalents $4,034,580 $4,059,882 Restricted cash 159,878
110,074 Net receivables 515,381 499,142 Inventory 2,263,537
2,067,454 Other current assets 268,365 194,465 Current assets
6,570,520 6,259,796 Current liabilities 7,241,741 6,931,017 Total
liabilities 23,022,980 16,750,167 Stockholders' equity 6,299,058
6,580,575 Year ended December 31, 2017 Loss before income taxes
$(2,209,032) Interest expense 537,925 Cash flows from operating
activities...
Selected balance sheet, income
statement and cash flow statement information from Tesla, Inc. for
2017 and 2016 follows ($ thousands). December 31 2017 2016 Cash and
cash equivalents $4,034,580 $4,059,882 Restricted cash 159,878
110,074 Net receivables 515,381 499,142 Inventory 2,263,537
2,067,454 Other current assets 268,365 194,465 Current assets
6,570,520 6,259,796 Current liabilities 7,241,741 6,931,017 Total
liabilities 23,022,980 16,750,167 Stockholders' equity 6,299,058
6,580,575 Year ended December 31, 2017 Loss before income taxes
$(2,209,032) Interest expense 537,925 Cash flows from operating
activities...
 Need help with what I got wrong, please.
December 31 2017 2016 Cash and cash equivalents $3,367,914 $3,393,216 Restricted cash 155,323 105,519 ws Net receivables Nec receivab 515,381 499,142 Inventory 2,263,537 2,067,454 40. Other current assets 268,365 194,465 Current assets 6,570,520 6,259,796 Current liabilities 7,674,670 5,827,005 Total liabilities 23,022,880 16,750,162 Stockholders' equity 5,632.392 5,913,909 Year ended December 31, 2017 Lass before income taxes $12,209,032) Interest expense 471,259 Cash flows from operating activities (60,654) Capital expenditures (3,414,814) Support a. Compute the...
Need help with what I got wrong, please.
December 31 2017 2016 Cash and cash equivalents $3,367,914 $3,393,216 Restricted cash 155,323 105,519 ws Net receivables Nec receivab 515,381 499,142 Inventory 2,263,537 2,067,454 40. Other current assets 268,365 194,465 Current assets 6,570,520 6,259,796 Current liabilities 7,674,670 5,827,005 Total liabilities 23,022,880 16,750,162 Stockholders' equity 5,632.392 5,913,909 Year ended December 31, 2017 Lass before income taxes $12,209,032) Interest expense 471,259 Cash flows from operating activities (60,654) Capital expenditures (3,414,814) Support a. Compute the...
 Compute and Interpret Coverage, Liquidity and Solvency Ratios Selected balance sheet and income statement information from Amazon for 2016 through 2018 follows. $ millions 2018 2017 2016 Net operating profit after tax (NOPAT) $10,978 $3,222 $2,556 Net income 10,073 3,033 2,371 Operating profit 12,421 4,106 4,186 Interest expense 1,417 848 484 Cash from operating activities 30,723 18,365 17,203 Current assets 75,101 60,197 45,781 Current liabilities 68,391 57,883 43,816 Cash and cash equivalents 31,750 20,522 19,334 Marketable securities 9,500 10,464 6,647...
 Compute and Interpret Liquidity, Solvency and Coverage Ratios Selected balance sheet and income statement information for Starbucks for 2018 and 2017 follows. ($ millions) Cash 2018 2017 $ 8,756.3 $2,462.3 181.5 228.6 Short-term investments Accounts receivable 693.1 870.4 Current assets 12,494.2 5,283.4 5,684.2 4,220.7 349.9 Current liabilities Short-term debt Long-term debt Total liabilities Interest expense Capital expenditures Equity Cash from operations Earnings before interest and taxes 9,090.2 3,932.6 22,980.6 8,908.6 170.3 92.5 1,976.4 1,519.4 1,175.8 5,457.0 11,937.8 4,251.8 3,883.3 4,134.7...
 Compute and Interpret Liquidity, Solvency and Coverage Ratios Selected balance sheet and income statement information for Nordstrom, Inc. for 2016 and 2015 follows. ole ($ millions) 2016 2015 Cash $ 595 $ 827 Accounts receivable 196 2,306 Current assets 3,014 5,224 Current liabilities 2,911 2,800 Long-term debt 2,795 3,123 Short-term debt 10 8 Total liabilities 6,827 6,805 Interest expense 153 156 Capital expenditures 1,082 861 Equity 871 2,440 Cash from operations 2,451 1,220 Earnings before interest and taxes 1,101 1,323...
Most questions answered within 3 hours.
-
Describe two obstacles that makes fixing atmospheric nitrogen
difficult.
asked 1 minute from now -
T
F 53) Most differences
between human groups are the result of biology rather than
culture....
asked 2 minutes ago -
A 5.20 mW helium neon laser emits a visible laser beam with a
wavelength of 633...
asked 5 minutes ago -
Assignment:
Your
organization has made a strategic decision
to
outsourcework
currently performed in house. You have...
asked 4 minutes ago -
A hospital performs 100 surgeries per week. The probability that
complications after surgery occur is 10%....
asked 5 minutes ago -
In preparing its cash flow statement for the year ended December
31, 2018, Green Co. gathered...
asked 7 minutes ago -
Donna is 18 years old and full time accounting student.She is
saving for an overseas holiday...
asked 7 minutes ago -
Service-oriented architectures (SOA) provide
object-oriented architectures for web platforms that represent a
collection of services. SOA...
asked 7 minutes ago -
Le Terroir Winery is considering an expansion project to produce
fine wines. The trial expansion will...
asked 17 minutes ago -
The Bahraini public budget experiences deficit in the last
seven years, what are procedures are taken...
asked 24 minutes ago -
You invested $30,000 in a mutual fund at the beginning of the
year when the NAV...
asked 27 minutes ago -
Would you expect the price elasticity of supply for guitars to
be more inelastic in the...
asked 29 minutes ago