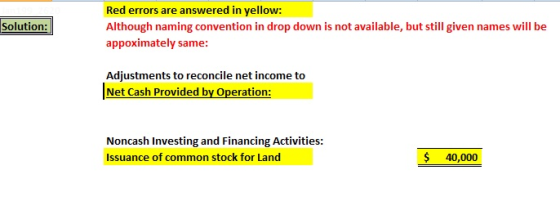
The comparative balance sheets for Spicer Company as of December 31 are presented below. Spicer Company Comparative Balance Sheets December 31 Assets 2022 2021 Cash $ 68,000 $ 45,000 Accounts receivable 50,000 58,000 Inventory 151,450 142,000 Prepaid expenses 15,280 21,000 Land 145,000 130,000 Buildings 200,000 200,000 Accumulated depreciation—buildings (60,000 ) (40,000 ) Equipment 225,000 155,000 Accumulated depreciation—equipment (45,000 ) (35,000 ) Total $749,730 $676,000 Liabilities and Stockholders’ Equity Accounts payable $ 44,730 $ 36,000 Bonds payable 300,000 300,000 Common stock, $1 par 200,000 160,000 Retained earnings 205,000 180,000 Total $749,730 $676,000 Additional information: 1. Operating expenses include depreciation expense of $42,000 ($20,000 of depreciation expense for buildings and $22,000 for equipment). 2. Land was sold for cash at book value. 3. Cash dividends of $12,000 were paid. 4. Net income for 2017 was $37,000. 5. Equipment was purchased for $92,000 cash. In addition, equipment costing $22,000 with a book value of $10,000 was sold for $8,000 cash. 6. 40,000 shares of $1 par value common stock were issued in exchange for land with a fair value of $40,000. Prepare a statement of cash flows for the year ended December 31, 2022, using the indirect method. (Show amounts that decrease cash flow with either a - sign e.g. -15,000 or in parenthesis e.g. (15,000).)


Homework Answers
Hi
Let me know in case you face any issue:
Add Answer to:
The comparative balance sheets for Spicer Company as of December
31 are presented below. Spicer Company...
Spicer Company Comparative Balance Sheets December 31 Assets Cash Accounts receivable Inventory Prepaid expenses Land Buildings...
 Spicer Company Comparative Balance Sheets December 31 Assets Cash Accounts receivable Inventory Prepaid expenses Land Buildings Accumulated depreciation-buildings Equipment Accumulated depreciation-equipment Total 2017 2016 $ 45,000 58,000 142,000 21,000 130,000 200,000 68,000 50,000 151,450 15,280 145,000 200,000 (60,000) (40,000) 225,000 (45,000) (35,000) 155,000 $749,730 $676,000 Liabilities and Stockholders Equity Accounts payable Bonds payable Common stock, $1 par Retained earnings Total $44,730 300,000 200,000 205,000 749,730 $676,000 $ 36,000 300,000 160,000 180,000 Additional information: 1. Operating expenses include depreciation expense of...
The comparative balance sheets for Spicer Company as of December 31 are presented below Spicer Company...
 The comparative balance sheets for Spicer Company as of December 31 are presented below Spicer Company Comparative Balance Sheets December 31 Assets Cash Accounts receivable Inventory Prepaid expenses Land Buildings Accumulated depreciation-buildings Equipment Accumulated depreciation-equipment Total 2017 2016 $ 45,000 58,000 142,000 21,000 130,000 200,000 (40,000 ) 155,000 68,000 50,000 151,450 15,280 145,000 200,000 (60,000) 225,000 (45,000) (35,000) $749,730 $676,000 Liabilities and Stockholders Equity Accounts payable Bonds payable Common stock, $1 par Retained earnings Total $ 36,000 300,000 160,000 180,000...
P12.11A (LO 2), AP The comparative balance sheets for Spicer Company as of December 31 are...
P12.11A (LO 2), AP The comparative balance sheets for Spicer Company as of December 31 are presented below. Prepare a statement of cash flows—indirect method. Spicer Company Comparative Balance Sheets December 31 Assets 2022 2021 Cash $ 68,000 $ 45,000 Accounts receivable 50,000 58,000 Inventory 151,450 142,000 Prepaid expenses 15,280 21,000 Land 145,000 130,000 Buildings 200,000 200,000 Accumulated depreciation—buildings (60,000) (40,000) Equipment 225,000 155,000 Accumulated depreciation—equipment (45,000) (35,000) Total $749,730 $676,000 Liabilities and Stockholders' Equity Accounts payable $ 44,730 $...
Rojas Corporation’s comparative balance sheets are presented below. ROJAS CORPORATION Comparative Balance Sheets December 31 2020...
 Rojas Corporation’s comparative balance sheets are presented
below.
ROJAS CORPORATION
Comparative Balance Sheets
December 31
2020
2019
Cash
$14,500
$10,700
Accounts receivable
20,800
23,800
Land
19,600
26,300
Buildings
70,100
70,100
Accumulated depreciation—buildings
(15,000
)
(10,700
)
Total
$110,000
$120,200
Accounts payable
$11,800
$28,300
Common stock
75,000
73,400
Retained earnings
23,200
18,500
Total
$110,000
$120,200
Additional information:
1.
Net income was $22,800. Dividends declared and paid were
$18,100.
2.
No noncash investing and financing activities occurred during
2020.
3.
The land...
Rojas Corporation’s comparative balance sheets are presented
below.
ROJAS CORPORATION
Comparative Balance Sheets
December 31
2020
2019
Cash
$14,500
$10,700
Accounts receivable
20,800
23,800
Land
19,600
26,300
Buildings
70,100
70,100
Accumulated depreciation—buildings
(15,000
)
(10,700
)
Total
$110,000
$120,200
Accounts payable
$11,800
$28,300
Common stock
75,000
73,400
Retained earnings
23,200
18,500
Total
$110,000
$120,200
Additional information:
1.
Net income was $22,800. Dividends declared and paid were
$18,100.
2.
No noncash investing and financing activities occurred during
2020.
3.
The land...
Here are comparative balance sheets for Velo Company. Velo Company Comparative Balance Sheets December 31 Assets...
 Here are comparative balance sheets for Velo Company.
Velo Company
Comparative Balance Sheets
December 31
Assets
2020
2019
Cash
$72,800
$33,200
Accounts receivable
86,500
70,700
Inventory
170,200
187,000
Land
72,700
100,700
Equipment
260,700
200,600
Accumulated depreciation—equipment
(65,700
)
(33,500
)
Total
$597,200
$558,700
Liabilities and Stockholders’ Equity
Accounts payable
$35,400
$46,500
Bonds payable
149,800
203,300
Common stock ($1 par)
218,000
173,000
Retained earnings
194,000
135,900
Total
$597,200
$558,700
Additional information:
1.
Net income for 2020 was $103,600.
2.
Cash dividends...
Here are comparative balance sheets for Velo Company.
Velo Company
Comparative Balance Sheets
December 31
Assets
2020
2019
Cash
$72,800
$33,200
Accounts receivable
86,500
70,700
Inventory
170,200
187,000
Land
72,700
100,700
Equipment
260,700
200,600
Accumulated depreciation—equipment
(65,700
)
(33,500
)
Total
$597,200
$558,700
Liabilities and Stockholders’ Equity
Accounts payable
$35,400
$46,500
Bonds payable
149,800
203,300
Common stock ($1 par)
218,000
173,000
Retained earnings
194,000
135,900
Total
$597,200
$558,700
Additional information:
1.
Net income for 2020 was $103,600.
2.
Cash dividends...
Blossom Company reported the following information for 2022. Blossom Company Comparative Balance Sheets December 31 Change...
 Blossom Company reported the following information for 2022. Blossom Company Comparative Balance Sheets December 31 Change Increase/Decrease Assets 2022 2021 Cash $165,200 173,600 123,200 $100,800 61,600 $64,400 Increase 112,000 Increase Accounts receivable Inventory -0- 123,200 Increase Prepaid expenses 16,800 11,200 5,600 Increase Land 154,000 196,000 42,000 Decrease Buildings 560,000 560,000 -0- Accumulated depreciation-buildings (58,800) (39,200) 19,600 Increase Equipment 512,400 (78,400) 190,400 (28,000) 322,000 Increase 50,400 Increase Accumulated depreciation-equipment Totals $1,568,000 $1,052,800 Liabilities and Stockholders' Equity Accounts payable $120,400 $112,000 $8,400...
Pharoah Company reported the following information for 2022. Pharoah Company Comparative Balance Sheets December 31 Assets...
 Pharoah Company reported the following information for 2022. Pharoah Company Comparative Balance Sheets December 31 Assets 2022 2021 Cash $41,300 $25,200 43,400 15,400 Accounts receivable Inventory Prepaid expenses Change Increase/Decrease $16,100 Increase 28,000 Increase 30,800 Increase 1,400 Increase 10,500 Decrease 30,800 -0- 4,200 2,800 Land 38,500 49,000 140,000 140,000 -0- (14,700) (9,800) Buildings Accumulated depreciation-buildings Equipment Accumulated depreciation-equipment 128,100 47,600 4,900 Increase 80,500 Increase 12,600 Increase (19,600) (7.000) $392,000 $263,200 Totals $30,100 $28,000 0 7,000 Liabilities and Stockholders' Equity Accounts...
Exercise 17-7 Rojas Corporation's comparative balance sheets are presented below. ROJAS CORPORATION Comparative Balance Sheets December...
 Exercise 17-7 Rojas Corporation's comparative balance sheets are presented below. ROJAS CORPORATION Comparative Balance Sheets December 31 2017 2016 Cash Accounts receivable Land Buildings Accumulated depreciation-buildings $15,000 21,100 19,700 70.000 (15.300) $10,700 23,900 25,900 70,000 (10,700) $119,800 Total $110.500 Accounts payable Common stock Retained earnings $11,900 75.400 23,200 $110.500 $28,600 72,300 18,900 $119,800 Total Additional information: 1. Net income was $22,900. Dividends declared and paid were $18,600. 2. No noncash investing and financing activities occurred during 2017 3. The land...
Velo Company Comparative Balance Sheets December 31 Assets 2020 2019 Cash $72,800 $33,200 Accounts receivable 86,500...
 Velo Company
Comparative Balance Sheets
December 31
Assets
2020
2019
Cash
$72,800
$33,200
Accounts receivable
86,500
70,700
Inventory
170,200
187,000
Land
72,700
100,700
Equipment
260,700
200,600
Accumulated depreciation—equipment
(65,700
)
(33,500
)
Total
$597,200
$558,700
Liabilities and Stockholders’ Equity
Accounts payable
$35,400
$46,500
Bonds payable
149,800
203,300
Common stock ($1 par)
218,000
173,000
Retained earnings
194,000
135,900
Total
$597,200
$558,700
Additional information:
1.
Net income for 2020 was $103,600.
2.
Cash dividends of $45,500 were declared and paid.
3.
Bonds...
Velo Company
Comparative Balance Sheets
December 31
Assets
2020
2019
Cash
$72,800
$33,200
Accounts receivable
86,500
70,700
Inventory
170,200
187,000
Land
72,700
100,700
Equipment
260,700
200,600
Accumulated depreciation—equipment
(65,700
)
(33,500
)
Total
$597,200
$558,700
Liabilities and Stockholders’ Equity
Accounts payable
$35,400
$46,500
Bonds payable
149,800
203,300
Common stock ($1 par)
218,000
173,000
Retained earnings
194,000
135,900
Total
$597,200
$558,700
Additional information:
1.
Net income for 2020 was $103,600.
2.
Cash dividends of $45,500 were declared and paid.
3.
Bonds...
 Spicer Company Comparative Balance Sheets December 31 Assets Cash Accounts receivable Inventory Prepaid expenses Land Buildings Accumulated depreciation-buildings Equipment Accumulated depreciation-equipment Total 2017 2016 $ 45,000 58,000 142,000 21,000 130,000 200,000 68,000 50,000 151,450 15,280 145,000 200,000 (60,000) (40,000) 225,000 (45,000) (35,000) 155,000 $749,730 $676,000 Liabilities and Stockholders Equity Accounts payable Bonds payable Common stock, $1 par Retained earnings Total $44,730 300,000 200,000 205,000 749,730 $676,000 $ 36,000 300,000 160,000 180,000 Additional information: 1. Operating expenses include depreciation expense of...
 The comparative balance sheets for Spicer Company as of December 31 are presented below Spicer Company Comparative Balance Sheets December 31 Assets Cash Accounts receivable Inventory Prepaid expenses Land Buildings Accumulated depreciation-buildings Equipment Accumulated depreciation-equipment Total 2017 2016 $ 45,000 58,000 142,000 21,000 130,000 200,000 (40,000 ) 155,000 68,000 50,000 151,450 15,280 145,000 200,000 (60,000) 225,000 (45,000) (35,000) $749,730 $676,000 Liabilities and Stockholders Equity Accounts payable Bonds payable Common stock, $1 par Retained earnings Total $ 36,000 300,000 160,000 180,000...
 Rojas Corporation’s comparative balance sheets are presented
below.
ROJAS CORPORATION
Comparative Balance Sheets
December 31
2020
2019
Cash
$14,500
$10,700
Accounts receivable
20,800
23,800
Land
19,600
26,300
Buildings
70,100
70,100
Accumulated depreciation—buildings
(15,000
)
(10,700
)
Total
$110,000
$120,200
Accounts payable
$11,800
$28,300
Common stock
75,000
73,400
Retained earnings
23,200
18,500
Total
$110,000
$120,200
Additional information:
1.
Net income was $22,800. Dividends declared and paid were
$18,100.
2.
No noncash investing and financing activities occurred during
2020.
3.
The land...
Rojas Corporation’s comparative balance sheets are presented
below.
ROJAS CORPORATION
Comparative Balance Sheets
December 31
2020
2019
Cash
$14,500
$10,700
Accounts receivable
20,800
23,800
Land
19,600
26,300
Buildings
70,100
70,100
Accumulated depreciation—buildings
(15,000
)
(10,700
)
Total
$110,000
$120,200
Accounts payable
$11,800
$28,300
Common stock
75,000
73,400
Retained earnings
23,200
18,500
Total
$110,000
$120,200
Additional information:
1.
Net income was $22,800. Dividends declared and paid were
$18,100.
2.
No noncash investing and financing activities occurred during
2020.
3.
The land...
 Here are comparative balance sheets for Velo Company.
Velo Company
Comparative Balance Sheets
December 31
Assets
2020
2019
Cash
$72,800
$33,200
Accounts receivable
86,500
70,700
Inventory
170,200
187,000
Land
72,700
100,700
Equipment
260,700
200,600
Accumulated depreciation—equipment
(65,700
)
(33,500
)
Total
$597,200
$558,700
Liabilities and Stockholders’ Equity
Accounts payable
$35,400
$46,500
Bonds payable
149,800
203,300
Common stock ($1 par)
218,000
173,000
Retained earnings
194,000
135,900
Total
$597,200
$558,700
Additional information:
1.
Net income for 2020 was $103,600.
2.
Cash dividends...
Here are comparative balance sheets for Velo Company.
Velo Company
Comparative Balance Sheets
December 31
Assets
2020
2019
Cash
$72,800
$33,200
Accounts receivable
86,500
70,700
Inventory
170,200
187,000
Land
72,700
100,700
Equipment
260,700
200,600
Accumulated depreciation—equipment
(65,700
)
(33,500
)
Total
$597,200
$558,700
Liabilities and Stockholders’ Equity
Accounts payable
$35,400
$46,500
Bonds payable
149,800
203,300
Common stock ($1 par)
218,000
173,000
Retained earnings
194,000
135,900
Total
$597,200
$558,700
Additional information:
1.
Net income for 2020 was $103,600.
2.
Cash dividends...
 Blossom Company reported the following information for 2022. Blossom Company Comparative Balance Sheets December 31 Change Increase/Decrease Assets 2022 2021 Cash $165,200 173,600 123,200 $100,800 61,600 $64,400 Increase 112,000 Increase Accounts receivable Inventory -0- 123,200 Increase Prepaid expenses 16,800 11,200 5,600 Increase Land 154,000 196,000 42,000 Decrease Buildings 560,000 560,000 -0- Accumulated depreciation-buildings (58,800) (39,200) 19,600 Increase Equipment 512,400 (78,400) 190,400 (28,000) 322,000 Increase 50,400 Increase Accumulated depreciation-equipment Totals $1,568,000 $1,052,800 Liabilities and Stockholders' Equity Accounts payable $120,400 $112,000 $8,400...
 Pharoah Company reported the following information for 2022. Pharoah Company Comparative Balance Sheets December 31 Assets 2022 2021 Cash $41,300 $25,200 43,400 15,400 Accounts receivable Inventory Prepaid expenses Change Increase/Decrease $16,100 Increase 28,000 Increase 30,800 Increase 1,400 Increase 10,500 Decrease 30,800 -0- 4,200 2,800 Land 38,500 49,000 140,000 140,000 -0- (14,700) (9,800) Buildings Accumulated depreciation-buildings Equipment Accumulated depreciation-equipment 128,100 47,600 4,900 Increase 80,500 Increase 12,600 Increase (19,600) (7.000) $392,000 $263,200 Totals $30,100 $28,000 0 7,000 Liabilities and Stockholders' Equity Accounts...
 Exercise 17-7 Rojas Corporation's comparative balance sheets are presented below. ROJAS CORPORATION Comparative Balance Sheets December 31 2017 2016 Cash Accounts receivable Land Buildings Accumulated depreciation-buildings $15,000 21,100 19,700 70.000 (15.300) $10,700 23,900 25,900 70,000 (10,700) $119,800 Total $110.500 Accounts payable Common stock Retained earnings $11,900 75.400 23,200 $110.500 $28,600 72,300 18,900 $119,800 Total Additional information: 1. Net income was $22,900. Dividends declared and paid were $18,600. 2. No noncash investing and financing activities occurred during 2017 3. The land...
 Velo Company
Comparative Balance Sheets
December 31
Assets
2020
2019
Cash
$72,800
$33,200
Accounts receivable
86,500
70,700
Inventory
170,200
187,000
Land
72,700
100,700
Equipment
260,700
200,600
Accumulated depreciation—equipment
(65,700
)
(33,500
)
Total
$597,200
$558,700
Liabilities and Stockholders’ Equity
Accounts payable
$35,400
$46,500
Bonds payable
149,800
203,300
Common stock ($1 par)
218,000
173,000
Retained earnings
194,000
135,900
Total
$597,200
$558,700
Additional information:
1.
Net income for 2020 was $103,600.
2.
Cash dividends of $45,500 were declared and paid.
3.
Bonds...
Velo Company
Comparative Balance Sheets
December 31
Assets
2020
2019
Cash
$72,800
$33,200
Accounts receivable
86,500
70,700
Inventory
170,200
187,000
Land
72,700
100,700
Equipment
260,700
200,600
Accumulated depreciation—equipment
(65,700
)
(33,500
)
Total
$597,200
$558,700
Liabilities and Stockholders’ Equity
Accounts payable
$35,400
$46,500
Bonds payable
149,800
203,300
Common stock ($1 par)
218,000
173,000
Retained earnings
194,000
135,900
Total
$597,200
$558,700
Additional information:
1.
Net income for 2020 was $103,600.
2.
Cash dividends of $45,500 were declared and paid.
3.
Bonds...
Most questions answered within 3 hours.
-
You capture data by having 8 people fill in 30 small dots on a
piece of...
asked 2 hours ago -
What are the z-values such that 70% of the area lies in the
middle of the...
asked 4 hours ago -
You borrow $29,500 to purchase a brand new car. The interest
rate is 6%, and the...
asked 4 hours ago -
The amount of time it takes an asteroid, whose average distance
from the Sun is 4.70...
asked 4 hours ago -
A 0.289 kg mass slides on a frictionless floor with a speed of
1.34 m/s. The...
asked 4 hours ago -
15.A box contains five red balls, three green balls, and two
yellow balls. Suppose you select...
asked 7 hours ago -
Assume you are given the following for Stackelberg industries:
Return on Assets (ROA) = 8%
Debt...
asked 6 hours ago -
an engineer proposes to use mmWave in 5G network to
increase data rate.
What are the...
asked 6 hours ago -
Explain the idea behind using SEMIJOIN in distributed
query processing.
asked 6 hours ago -
why
is context important in selecting and applying guidelines and
principles for interface design?
illustrate your...
asked 6 hours ago -
In a certain board game, a player rolls two fair six-sided dice
until the player rolls...
asked 7 hours ago -
You are going to deposit $3,200 in an account that pays .58
percent interest compounded quarterly....
asked 6 hours ago