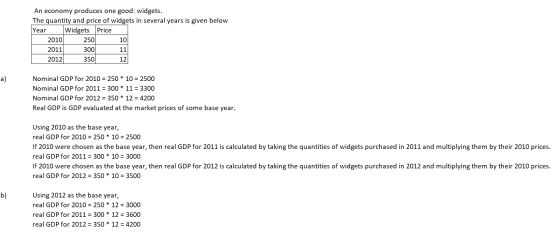
3. An economy produces one good: widgets. The quantity and price of widgets in several years...
Homework Answers
Add Answer to:
3. An economy produces one good: widgets. The quantity and
price of widgets in several years...
please work on that carefully. thank you 1. Say whether each of the following is or...
please work on that carefully. thank you 1. Say whether each of the following is or is not counted (directly) as part of GDP. a. David mows his lawn. b. David starts a landscaping company and mows his neighbor’s lawn for money. c. David buys a new lawnmower for his landscaping business. d. David buys a used truck for his business. 2. Say which category of GDP each of the following falls into. a. A sewing machine b. A cheeseburger...
Styles 1. Say whether each of the following is or is not counted (directly) as part...
 Styles 1. Say whether each of the following is or is not counted (directly) as part of GDP. a. David mows his lawn. b. David starts a landscaping company and mows his neighbor's lawn for money. c. David buys a new lawnmower for his landscaping business. d. David buys a used truck for his business. 2. Say which category of GDP each of the following falls into. a. A sewing machine b. A cheeseburger C. A fighter jet 3. An...
Assume that an economy produces only three goods; Computers, cars, and pizza. Table 1 gives the price and quantity for each good and the number of employed and unemployed individuals for the years 2010-2013. Table 2 gives the fixed basket used for calcula
 Assume that an economy produces
only three goods; Computers, cars, and pizza. Table 1 gives the price
and quantity for each good and the number of employed and unemployed
individuals for the years 2010-2013. Table 2 gives the fixed basket used
for calculating the CPI. Assume that the base year is 2011 and show
your work! Table 1 - Price and Quantity of Goods Sold in 2010-2013 2010
2011 2012 2013 P Q P O P Q 25 Computers Cars...
Assume that an economy produces
only three goods; Computers, cars, and pizza. Table 1 gives the price
and quantity for each good and the number of employed and unemployed
individuals for the years 2010-2013. Table 2 gives the fixed basket used
for calculating the CPI. Assume that the base year is 2011 and show
your work! Table 1 - Price and Quantity of Goods Sold in 2010-2013 2010
2011 2012 2013 P Q P O P Q 25 Computers Cars...
5. The economy of Britannica produces three Year Computers DVDs Pizzas goods: computers, DVDs, and pizza....
 5. The economy of Britannica produces three Year Computers DVDs Pizzas goods: computers, DVDs, and pizza. The Price Quantity Price Quantity Price Quantity accompanying table shows the prices and 2010 $900 10 $10 100 15 2 output of the three goods for the years 2011 1,000 10.5 12 105 16 2 2012 1,050 12 14 110 2010, 2011, and 2012. a. Calculate nominal GDP in Britannica for each of the three years. What is the per- cent change in nominal...
2010 Prices 2010 Quantity 2011 Prices 2011 Quantity 2012 Prices 2012 Quantity Apples $3 5 $3...
2010 Prices 2010 Quantity 2011 Prices 2011 Quantity 2012 Prices 2012 Quantity Apples $3 5 $3 11 $3 8 Oranges $2 9 $9 3 $1 10 Nominal GDP Real GDP A. Calculate the nominal and the real GDP in each year for the economy. 2010 is your base year. B. If the real GDP was $150 in 2013 and $182 in 2014, what would the GDP growth rate would be? What would this mean? C. If the nominal GDP was $250 in 2014...
Suppose an economy produces only two goods, cups of coffee and gallons of milk as shown...
 Suppose an economy produces only two goods, cups of coffee and gallons of milk as shown in Table below: TABLE Nominal versus real GDP YEAR COFFEE (CUPS) MILK (GALLONS) GDP (NOMINAL, REAL) 2010 (The Price $1.00 Quantity 10 Price $2.00 Quantity 20 base year) Expenditure Price $1.50 Quantity 10 Price $4.00 Quantity 20 2011 (Case 1) Expenditure Price $1.00 Quantity 15 Price $2.00 Quantity 40 2011 (Case 2) Expenditure Price $1.50 Quantity 15 Price $4.00 Quantity 40 2011 (Case 3)...
- Work It Out • Consider an economy that produces and consumes hot dogs and hamburgers....
 - Work It Out • Consider an economy that produces and consumes hot dogs and hamburgers. In the following table are data for two different years. 2010 2018 Good Hot dogs Hamburgers Quantity 200 200 Price Quantity $2 250 $3 500 Price $4 $4 a. Using 2010 as the base year, compute the following statistics for each year: nominal GDP, real GDP, the implicit price deflator for GDP, and the CPI. b. By what percentage did prices rise between 2010...
The country of Sylvania produces and consumes only three goods: Red Bull, pizza, and T-shirts. The quantity produced and price of each good in 2011 and 2012 are given in the following table:
The country of Sylvania produces and consumes only three goods: Red Bull, pizza, and T-shirts. The quantity produced and price of each good in 2011 and 2012 are given in the following table:20112012QuantityPriceQuantityPriceT-Shirts90$25108$25Red Bull (cans)510$2510$3Pizza (slices)980$3900$6Nominal GDP in 2011 was $nothing and nominal GDP in 2012 was $nothing. (Enter your responses as integers.)If 2011 is the base year, real GDP in 2011 was $nothing and real GDP in 2012 was $nothing. (Enter your responses as integers.)Based on your answer above, the percentage change in real GDP between 2011...
An economy produces only robots, pens, and pizza
 An economy produces only robots, pens, and pizza The table gives the quantities produced and prices in 2016 and 2017 The base your is 2016 What is nominal GDP in 2016 and in 2017? Nominal GDP in 2016 is $_______ Nominal GDP in 2017 is $_______ A south sea island produces only coconuts In 2010, the price of a coconut is $2.00 and the quantity produced is 350 In 2017, the price of a coconut is $1.50 and the quantity produced is 300 2010 is the base year Real GDP...
7. LounchPad . Consider an economy that produces and consumes hot dogs and ham- burgers. In...
 7. LounchPad . Consider an economy that produces and consumes hot dogs and ham- burgers. In the following table are data for two different years 2013 2015 Good Hot dogs Hamburgers Quantity Quantity Price 250 $4 500 $4 200 $$2 200 $3 a. Using 2010 as the base year, compute the following statistics for each year: nominal GDP, real GDP, the implicit price deflator for GDP, and a fixed-weight price index such as the CPI. b. By what percentage did...
 Styles 1. Say whether each of the following is or is not counted (directly) as part of GDP. a. David mows his lawn. b. David starts a landscaping company and mows his neighbor's lawn for money. c. David buys a new lawnmower for his landscaping business. d. David buys a used truck for his business. 2. Say which category of GDP each of the following falls into. a. A sewing machine b. A cheeseburger C. A fighter jet 3. An...
 5. The economy of Britannica produces three Year Computers DVDs Pizzas goods: computers, DVDs, and pizza. The Price Quantity Price Quantity Price Quantity accompanying table shows the prices and 2010 $900 10 $10 100 15 2 output of the three goods for the years 2011 1,000 10.5 12 105 16 2 2012 1,050 12 14 110 2010, 2011, and 2012. a. Calculate nominal GDP in Britannica for each of the three years. What is the per- cent change in nominal...
 Suppose an economy produces only two goods, cups of coffee and gallons of milk as shown in Table below: TABLE Nominal versus real GDP YEAR COFFEE (CUPS) MILK (GALLONS) GDP (NOMINAL, REAL) 2010 (The Price $1.00 Quantity 10 Price $2.00 Quantity 20 base year) Expenditure Price $1.50 Quantity 10 Price $4.00 Quantity 20 2011 (Case 1) Expenditure Price $1.00 Quantity 15 Price $2.00 Quantity 40 2011 (Case 2) Expenditure Price $1.50 Quantity 15 Price $4.00 Quantity 40 2011 (Case 3)...
 - Work It Out • Consider an economy that produces and consumes hot dogs and hamburgers. In the following table are data for two different years. 2010 2018 Good Hot dogs Hamburgers Quantity 200 200 Price Quantity $2 250 $3 500 Price $4 $4 a. Using 2010 as the base year, compute the following statistics for each year: nominal GDP, real GDP, the implicit price deflator for GDP, and the CPI. b. By what percentage did prices rise between 2010...
 7. LounchPad . Consider an economy that produces and consumes hot dogs and ham- burgers. In the following table are data for two different years 2013 2015 Good Hot dogs Hamburgers Quantity Quantity Price 250 $4 500 $4 200 $$2 200 $3 a. Using 2010 as the base year, compute the following statistics for each year: nominal GDP, real GDP, the implicit price deflator for GDP, and a fixed-weight price index such as the CPI. b. By what percentage did...
Most questions answered within 3 hours.
-
Write a program to solve the Josephus problem, with the following
modification:
Sample Input:
./a.out n...
asked 37 minutes ago -
At the start of a CD it is spinning at a rate of 525 rpm
(revolutions...
asked 1 hour ago -
4. Without doing any calculations, predict whether the observed
∆T would increase, decrease or remain the...
asked 2 hours ago -
Based on the range, which of the following sets of scores has
the greatest variability? 3,...
asked 3 hours ago -
Ripples in a pond travel at a velocity of 3 m/s with one peak
passing a...
asked 3 hours ago -
A man stands on the roof of a building of height 13.0 mm and
throws a...
asked 3 hours ago -
The extent to which assets are financed by borrowed funds and
other liabilities is indicated by:...
asked 4 hours ago -
Explain in detail
Germany is the fifth largest economy
explain what goods and services Germany specializes...
asked 4 hours ago -
The density of platinum is 21.45 g/mL. If a cube of platinum
with a mass of...
asked 4 hours ago -
Accounts Receivable
Sales
A/R Posting
Extended Sales Invoice
Packing Slip
Compare invoice to packing slip 2...
asked 4 hours ago -
Michaella, age 23, is a full-time law student and is claimed by
her parents as a...
asked 4 hours ago -
Why are polymers not typically casted into products?
asked 5 hours ago