
Homework Answers
This problem is solved by simple defination of position and
velocity and acceleration.
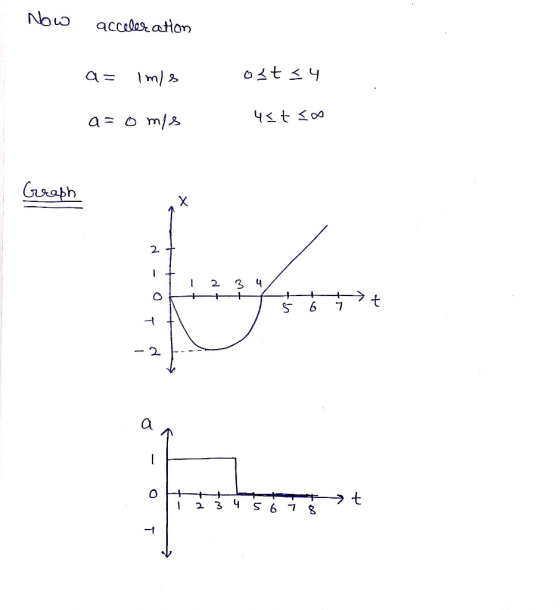
B) The acceleration of particle at t=3s is 1m/s2
Add Answer to:
#20
100 FIGURE P2.18 02 Section 2.4 Acceleration t (s) 28, W 80 takec a. W...
#4 Angeles FIGURE P2.2 a. Who 3. Il The b. How e position graph of Figure...
 #4
Angeles FIGURE P2.2 a. Who 3. Il The b. How e position graph of Figure P2.3 shows a dog slowly sneak- ng up on a squirrel, then putting on a burst or the lower sped? 10. Il Richa are on th Normall ning late How ma a. For how many seconds does the dog move at the slower b. Draw the velocity-ve dog's velocity-versus-time graph. Include a numerical scale on both axes. 11. Il In a 5 another to...
#4
Angeles FIGURE P2.2 a. Who 3. Il The b. How e position graph of Figure P2.3 shows a dog slowly sneak- ng up on a squirrel, then putting on a burst or the lower sped? 10. Il Richa are on th Normall ning late How ma a. For how many seconds does the dog move at the slower b. Draw the velocity-ve dog's velocity-versus-time graph. Include a numerical scale on both axes. 11. Il In a 5 another to...
2 A train is at rest in a railway station. At time t = 0, the...
 2 A train is at rest in a railway station. At time t = 0, the train starts to move forwards with an increasing speed until it reaches its maximum speed at time t = 48 s. Fig. 1.1 is the speed-time graph for the first 48s of the journey. 40 30- speed m/s 20- 10- 0 20 40 60 80 100 120 time/s Fig. 1.1 (a) (0) State how the graph shows that, during the first 48s of the...
The figure gives the acceleration a versus time t for a particle moving along an x...
 The figure gives the acceleration a versus time t for a particle
moving along an x axis. The a-axis scale is set by as = 16.0 m/s2.
At t = -2.0 s, the particle's velocity is 8.00 m/s. What is its
velocity at t = 6.0 s? A graph has a vertical axis labeled a sub s
and a horizontal axis labeled t of s. The variable a is presented
in meters per second squared. A line passes through (0,...
The figure gives the acceleration a versus time t for a particle
moving along an x axis. The a-axis scale is set by as = 16.0 m/s2.
At t = -2.0 s, the particle's velocity is 8.00 m/s. What is its
velocity at t = 6.0 s? A graph has a vertical axis labeled a sub s
and a horizontal axis labeled t of s. The variable a is presented
in meters per second squared. A line passes through (0,...
11. Figure below shows hypothetical velocity-time graphs. Sketch qualitatively the corresponding acceleration-time graph. v (m/s) v...
 11. Figure below shows hypothetical velocity-time graphs. Sketch qualitatively the corresponding acceleration-time graph. v (m/s) v (m/s) *tis) (511 Case(i) Case(i)
The graph in Figure 1 shows the displacement versus position for the wave at t =...
 The graph in Figure 1 shows the displacement versus position for
the wave at t = 1:0 s. The graph in Figure 2 shows the displacement
versus time for the wave at x = 1:0 m. Determine the displacement
equation D(x,t) and the velocity of the wave. SHOW WORK
Plnti Plot: Figure 1: D(x) (m) vrs. r (m) Figure 2: D(t) (m) vrs. t (s) igure I: D(c) (m) vrs. m
The graph in Figure 1 shows the displacement versus position for
the wave at t = 1:0 s. The graph in Figure 2 shows the displacement
versus time for the wave at x = 1:0 m. Determine the displacement
equation D(x,t) and the velocity of the wave. SHOW WORK
Plnti Plot: Figure 1: D(x) (m) vrs. r (m) Figure 2: D(t) (m) vrs. t (s) igure I: D(c) (m) vrs. m
The figure(Figure 1) shows the velocity graph of a particle moving along the x-axis. Its initial position is x0 = 2 m at t0 = 0. At t = 3 s
 The figure(Figure 1) shows the velocity graph of a particle moving along the x-axis. Its initial position is x0 = 2 m at t0 = 0. At t = 3 s , what are the particle's (a) position, (b) velocity, and (c) acceleration? Part A Express your answer to two significant figures and include the appropriate units. Part B Express your answer to two significant figures and include the appropriate units. Part C Express your answer to two significant figures and include the...
SPM 2014/2015 Distinguish between distance and displacement. (a) 40 m s 70 m FIGURE 1 FIGURE...
 SPM 2014/2015 Distinguish between distance and displacement. (a) 40 m s 70 m FIGURE 1 FIGURE 1 shows a stone is thrown horizontally with initial velocity 40 ms from the top of 70 m high building (b) (i) Sketch the path traversed by the stone to the ground and indicate the velocity components and resultant velocity of the stone 15 m from the ground Calculate the resultant velocity of the stone 15 m from the ground () [Answer: v-51.73 ms)...
In-Class Assignment 2. The figure shows a position-versus-time graph for an oscillating mass m = 0.5...
 In-Class Assignment 2. The figure shows a position-versus-time graph for an oscillating mass m = 0.5 kg. x (cm) 20 10 0 -10 -20 I(s) 4 a. Determine the period of the motion. b. Determnine the angular frecquemcy of the motion c. Determine the amplitude of the motion. d. Determine the phase constant of the motion. e. Determine the maximum speed of the mass. f. Determine the maximum acceleration of the mass. g. Determine the total energy of the system....
A particle slides along a straight wire so that a--k/v where a is the acceleration, v is the velocity and k-20 m3/s. The particle stars at X 0, t-0, with a speed vo 10 m/s. 2. When the particle is at...
 A particle slides along a straight wire so that a--k/v where a is the acceleration, v is the velocity and k-20 m3/s. The particle stars at X 0, t-0, with a speed vo 10 m/s. 2. When the particle is at x = 4 m, the speed v is most nearly A. 2.49 m/s B. 3.46 m/s C. 5.29 m/s D. 6.93 m/s E. 7.50 m/s F. 8.62 m/s G. 8.88 m/s H. 9.13 m/s I 9.81 m/s J. 10.00...
The figure shows a position versus time graph for a red blood cell leaving the heart....
 The figure shows a position versus time graph for a red blood cell leaving the heart. Determine the instantaneous speed v of the red blood cell when t 13 ms. m/s 0 2 4 6 8 10 12 14 16 18 20 Time (ms) A runner is training for an upcoming race. In order to track the pace of the run, the runner is able to record time splits for the entire period. This allows the runner to produce the...
 #4
Angeles FIGURE P2.2 a. Who 3. Il The b. How e position graph of Figure P2.3 shows a dog slowly sneak- ng up on a squirrel, then putting on a burst or the lower sped? 10. Il Richa are on th Normall ning late How ma a. For how many seconds does the dog move at the slower b. Draw the velocity-ve dog's velocity-versus-time graph. Include a numerical scale on both axes. 11. Il In a 5 another to...
#4
Angeles FIGURE P2.2 a. Who 3. Il The b. How e position graph of Figure P2.3 shows a dog slowly sneak- ng up on a squirrel, then putting on a burst or the lower sped? 10. Il Richa are on th Normall ning late How ma a. For how many seconds does the dog move at the slower b. Draw the velocity-ve dog's velocity-versus-time graph. Include a numerical scale on both axes. 11. Il In a 5 another to...
 2 A train is at rest in a railway station. At time t = 0, the train starts to move forwards with an increasing speed until it reaches its maximum speed at time t = 48 s. Fig. 1.1 is the speed-time graph for the first 48s of the journey. 40 30- speed m/s 20- 10- 0 20 40 60 80 100 120 time/s Fig. 1.1 (a) (0) State how the graph shows that, during the first 48s of the...
 The figure gives the acceleration a versus time t for a particle
moving along an x axis. The a-axis scale is set by as = 16.0 m/s2.
At t = -2.0 s, the particle's velocity is 8.00 m/s. What is its
velocity at t = 6.0 s? A graph has a vertical axis labeled a sub s
and a horizontal axis labeled t of s. The variable a is presented
in meters per second squared. A line passes through (0,...
The figure gives the acceleration a versus time t for a particle
moving along an x axis. The a-axis scale is set by as = 16.0 m/s2.
At t = -2.0 s, the particle's velocity is 8.00 m/s. What is its
velocity at t = 6.0 s? A graph has a vertical axis labeled a sub s
and a horizontal axis labeled t of s. The variable a is presented
in meters per second squared. A line passes through (0,...
 11. Figure below shows hypothetical velocity-time graphs. Sketch qualitatively the corresponding acceleration-time graph. v (m/s) v (m/s) *tis) (511 Case(i) Case(i)
 The graph in Figure 1 shows the displacement versus position for
the wave at t = 1:0 s. The graph in Figure 2 shows the displacement
versus time for the wave at x = 1:0 m. Determine the displacement
equation D(x,t) and the velocity of the wave. SHOW WORK
Plnti Plot: Figure 1: D(x) (m) vrs. r (m) Figure 2: D(t) (m) vrs. t (s) igure I: D(c) (m) vrs. m
The graph in Figure 1 shows the displacement versus position for
the wave at t = 1:0 s. The graph in Figure 2 shows the displacement
versus time for the wave at x = 1:0 m. Determine the displacement
equation D(x,t) and the velocity of the wave. SHOW WORK
Plnti Plot: Figure 1: D(x) (m) vrs. r (m) Figure 2: D(t) (m) vrs. t (s) igure I: D(c) (m) vrs. m
 SPM 2014/2015 Distinguish between distance and displacement. (a) 40 m s 70 m FIGURE 1 FIGURE 1 shows a stone is thrown horizontally with initial velocity 40 ms from the top of 70 m high building (b) (i) Sketch the path traversed by the stone to the ground and indicate the velocity components and resultant velocity of the stone 15 m from the ground Calculate the resultant velocity of the stone 15 m from the ground () [Answer: v-51.73 ms)...
 In-Class Assignment 2. The figure shows a position-versus-time graph for an oscillating mass m = 0.5 kg. x (cm) 20 10 0 -10 -20 I(s) 4 a. Determine the period of the motion. b. Determnine the angular frecquemcy of the motion c. Determine the amplitude of the motion. d. Determine the phase constant of the motion. e. Determine the maximum speed of the mass. f. Determine the maximum acceleration of the mass. g. Determine the total energy of the system....
 A particle slides along a straight wire so that a--k/v where a is the acceleration, v is the velocity and k-20 m3/s. The particle stars at X 0, t-0, with a speed vo 10 m/s. 2. When the particle is at x = 4 m, the speed v is most nearly A. 2.49 m/s B. 3.46 m/s C. 5.29 m/s D. 6.93 m/s E. 7.50 m/s F. 8.62 m/s G. 8.88 m/s H. 9.13 m/s I 9.81 m/s J. 10.00...
 The figure shows a position versus time graph for a red blood cell leaving the heart. Determine the instantaneous speed v of the red blood cell when t 13 ms. m/s 0 2 4 6 8 10 12 14 16 18 20 Time (ms) A runner is training for an upcoming race. In order to track the pace of the run, the runner is able to record time splits for the entire period. This allows the runner to produce the...
Most questions answered within 3 hours.
-
4. Without doing any calculations, predict whether the observed
∆T would increase, decrease or remain the...
asked 5 minutes ago -
Based on the range, which of the following sets of scores has
the greatest variability? 3,...
asked 1 hour ago -
Ripples in a pond travel at a velocity of 3 m/s with one peak
passing a...
asked 1 hour ago -
A man stands on the roof of a building of height 13.0 mm and
throws a...
asked 1 hour ago -
The extent to which assets are financed by borrowed funds and
other liabilities is indicated by:...
asked 2 hours ago -
Explain in detail
Germany is the fifth largest economy
explain what goods and services Germany specializes...
asked 2 hours ago -
The density of platinum is 21.45 g/mL. If a cube of platinum
with a mass of...
asked 2 hours ago -
Accounts Receivable
Sales
A/R Posting
Extended Sales Invoice
Packing Slip
Compare invoice to packing slip 2...
asked 2 hours ago -
Michaella, age 23, is a full-time law student and is claimed by
her parents as a...
asked 2 hours ago -
Why are polymers not typically casted into products?
asked 2 hours ago -
When rolling a die 129 times, what is the probability of rolling
a 6 no more...
asked 3 hours ago -
4. A call option currently sells for $7.75. It has a strike
price of $85 and...
asked 2 hours ago