

Homework Answers
Answer #1
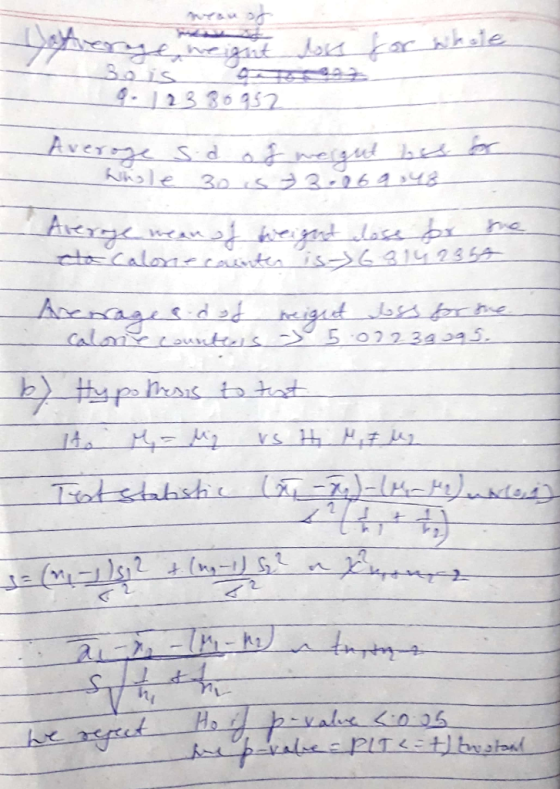
I have done the part "a" of the question in the pic that I have attached with "b".
b)
| Column1 | Column2 | Column3 |
| t-Test: Two-Sample Assuming Equal Variances | ||
| Variable 1 | Variable 2 | |
| Mean | 9.123809524 | 6.814285714 |
| Variance | 0.632590012 | 1.485644599 |
| Observations | 42 | 42 |
| Pooled Variance | 1.059117305 | |
| Hypothesized Mean Difference | 0 | |
| df | 82 | |
| t Stat | 10.28395243 | |
| P(T<=t) one-tail | 1.02818E-16 | |
| t Critical one-tail | 1.663649184 | |
| P(T<=t) two-tail | 2.05636E-16 | |
| t Critical two-tail | 1.989318557 | |
c)
| Column1 | Column2 | Column3 |
| t-Test: Paired Two Sample for Means | ||
| Variable 1 | Variable 2 | |
| Mean | 9.123809524 | 6.81428571 |
| Variance | 0.632590012 | 1.4856446 |
| Observations | 42 | 42 |
| Pearson Correlation | 0.224564186 | |
| Hypothesized Mean Difference | 0 | |
| df | 41 | |
| t Stat | 11.53789178 | |
| P(T<=t) one-tail | 9.3677E-15 | |
| t Critical one-tail | 1.682878002 | |
| P(T<=t) two-tail | 1.87354E-14 | |
| t Critical two-tail | 2.01954097 | |
 all hand written conclusions
are drawn on the basis of the tables that I have attached with
answer "b" and "c",and answer "d" is based on them.
all hand written conclusions
are drawn on the basis of the tables that I have attached with
answer "b" and "c",and answer "d" is based on them.
Know the answer?
Add Answer to:
Whole 30 Calorie Counters Standard Deviation 4.20 3.42 2.41 3.06 3.04 2.58 3.48 2.93 2.68 2.02...
Not the answer you're looking for?
Ask your own homework help question.
Our experts will answer your question WITHIN MINUTES for Free.
Similar Homework Help Questions
ADVERTISEMENT
Need Online Homework Help?
Ask
a QuestionGet Answers For Free
Most questions answered within 3 hours.
Most questions answered within 3 hours.
ADVERTISEMENT
ADVERTISEMENT
Active Questions
-
R1.6: Twenty-one randomly selected managers in the healthcare
industry were sampled with regard to their average...
asked 12 minutes ago -
P7-3 Evaluating Four Alternative Inventory Methods Based on
Income and Cash Flow LO7-2, 7-3 [The following...
asked 11 minutes ago -
The fragment sizes that you determined from your gel may not be
exactly correct (i.e. they...
asked 13 minutes ago -
A child on a sled is initially at rest on an icy horizontal
surface. The sled...
asked 28 minutes ago -
Elasticity: explain the difference in an increase in the price
of gasoline versus an increase in...
asked 26 minutes ago -
Using Python
What will the following code display?
names = [‘Vernon’, ‘Cooper’, ‘Ronnie’,
‘Clay’]
if ‘Jordan’...
asked 29 minutes ago -
which of the following would the particles be closest together?
liquid water, gaseous flourine, solid ice,...
asked 31 minutes ago -
Consider again the hypothetical population with two genes, each
with two alleles (A & a, B...
asked 33 minutes ago -
When the player of a game chooses a dominant strategy,
Select one:
a. it is the...
asked 43 minutes ago -
which of the followinf taxes are not subject to the innocent spouse
asked 43 minutes ago -
1) True or False? A researcher applies a simple
regression to get the results shown below...
asked 46 minutes ago -
33) Many computer programs provide two sets of results for the t
test for independent means....
asked 48 minutes ago
ADVERTISEMENT