

Homework Answers
(Q1)
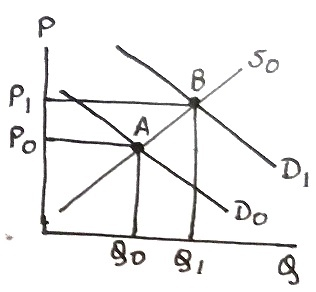
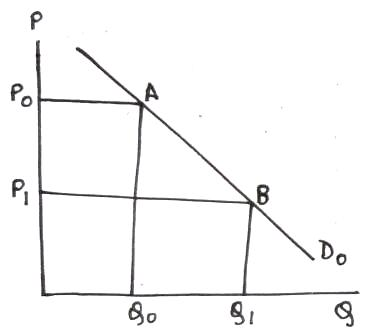
In each of the graphs, D0 and S0 represent initial demand and supply curves of pear juice, intersecting at point A. Initial price is P0 and quantity is Q0.
(a)
Increase in price of orange juice, a substitute, will increase demand for pear juice. Increase in demand shifts demand curve rightward, increasing both price and quantity. In following graph, D0 shifts right to D1, intersecting S0 at point B with higher price P1 and higher quantity Q1.
(b)
Lower price of pear juice will increase its quantity demanded, causing a downward movement along demand curve from point A to point B where price falls from P0 to P1 and quantity rises from Q0 to Q1.
(c)
Expected fall in future price will decrease current consumption, decreasing demand. Decrease in demand shifts demand curve leftward, decreasing both price and quantity. In following graph, D0 shifts left to D1, intersecting S0 at point B with lower price P1 and lower quantity Q1.
(d)
The typhoon will decrease market supply of pears, lowering supply of pear juice. Decrease in supply shifts supply curve leftward, increasing price and decreasing quantity. In following graph, S0 shifts left to S1, intersecting D0 at point B with higher price P1 and lower quantity Q1.

(e)
From part (a), higher demand increases price and increases quantity. From part (d), lower supply increases price and decreases quantity. Net effect is a definite increase in price but effect on quantity is uncertain, giving rise to following three possibilities.
(1) Rightward shift in demand is more than the leftward shift in supply: Quantity increases
In following graph, D0 shifts right to D1 and S0 shifts left to S1, intersecting at point B with higher price P1 and higher quantity Q1.

(2) Rightward shift in demand is less than the leftward shift in supply: Quantity decreases
In following graph, D0 shifts right to D1 and S0 shifts left to S1, intersecting at point B with higher price P1 and lower quantity Q1.

(3) Rightward shift in demand is equal to the leftward shift in supply: Quantity remains the same
In following graph, D0 shifts right to D1 and S0 shifts left to S1, intersecting at point B with higher price P1 and same quantity Q0.

NOTE: As HOMEWORKLIB Answering Policy, 1st question has been answered.
Add Answer to:
01/ (Total marks: 30 marks) Consider the market for Pear juice in a city. What will...
In Pioneer Ville, the price elasticity of demand for bus rides is 0.8, the income elasticity...
In Pioneer Ville, the price elasticity of demand for bus rides is 0.8, the income elasticity of bus rides is -1.2 and cross price elasticity of demand for bus rides with respect to gasoline is 1.1. a) Is the demand for bus rides elastic or inelastic? Why? b) Would an increase in the price of bus rides increase the bus companys total revenue? Explain your answer. c) If incomes increase by 5 percent with no change in prices, how will...
What are the main two differences between the Free market and Command Market? (2 Marks) ...
What are the main two differences between the Free market and Command Market? (2 Marks) Calculate the values in this table (5 Marks) Quantity Price FC TVC TC MC TR MR AFC AVC ATC 1 30 10 10 X X 2 25 15 3 20 18 With a 30% change in a product price, the demand for the product changes by 60%. What is the price elasticity of demand for this product? (Show Formula) (3 Marks) Define the following...
(9 marks) Suppose the market for copper is represented by: Q = 5P2 - 200 Q...
 (9 marks) Suppose the market for copper is represented by: Q = 5P2 - 200 Q = 1,300 - 10P2 Find the market equilibrium price and quantity. (2 marks) Find the price elasticity of demand at the equilibrium. Show your steps. (3 marks) Suppose there is a rise in the supply of copper in the market. Based on your result in (b), explain how the total sales revenue in the copper market will change. (4 marks)
(10 marks) Suppose the market for apples is represented by: Supply: Demand: QP Q=36-3P Find the...
 (10 marks) Suppose the market for apples is represented by: Supply: Demand: QP Q=36-3P Find the market cquilibrium price and quantity. (2 marks) b. Find the price elasticity of demand at the equilibrium. (3 marks) Suppose bad weather results in a poor harvest of apples. Using the price elasticity calculated in (b), explain its effect on the total revenue of the apple farmers (5 marks) S2 Assignment 1 v2.docx (9 marks) In December 2019, The Travel Industry Council of Hong...
please help me with as much as you could Calculus (4 marks) A firm estimates that the total revenue, SR(q), received from the sale of q goods is given by 5. R(x) = ln(1 + 1000 ) Calculate the mar...
 please help me with as much as you could
Calculus (4 marks) A firm estimates that the total revenue, SR(q), received from the sale of q goods is given by 5. R(x) = ln(1 + 1000 ) Calculate the marginal revenue when q = 10. Explain what this result means. 6, (3 marks) Consider the function f(x) = x3 + 2. (a) Sketch a graph of y-f(x) on I-1,2 (b) Estimate the area bounded by y-f(x), the x-axis and the...
please help me with as much as you could
Calculus (4 marks) A firm estimates that the total revenue, SR(q), received from the sale of q goods is given by 5. R(x) = ln(1 + 1000 ) Calculate the marginal revenue when q = 10. Explain what this result means. 6, (3 marks) Consider the function f(x) = x3 + 2. (a) Sketch a graph of y-f(x) on I-1,2 (b) Estimate the area bounded by y-f(x), the x-axis and the...
1- We are examining the market for gold picture frames in Ontario. Given below are the...
1- We are examining the market for gold picture frames in Ontario. Given below are the demand schedule and supply schedule for this product for one year. Accurately graph the demand and supply curves on one graph and determine equilibrium in this market. Label the graph and axises properly. State where equilibrium is (both price and quantity), don’t just point to it on the graph. Make sure you have the price and quantity demanded on the correct axis. (5 marks...
1. Consider the market for new cars. e. Suppose the U.S. Environmental Protection Agency announces it...
1. Consider the market for new cars. e. Suppose the U.S. Environmental Protection Agency announces it will require new light trucks and sport utility vehicles (SUVs) to install pollution control devices that will increase their cost. How will the supply and demand curves (if either) for cars be affected? (Assume cars and SUVs are considered different goods.) What will happen to the equilibrium price and quantity of cars? f. Consider the difference between the short run of a few days...
2-Consider the market for minivans. For each of the events listed here, identity which of the determinants of deman...
 2-Consider the market for minivans. For each of the events listed here, identity which of the determinants of demand or supply are affected. Also indicate whether demand or supply increases or decreases. Then draw a diagram to show the effect on the price and quantity of minivans. a. People decide to have more children. b. A strike by steelworkers raises steel prices. c. Engineers develop new automated machinery for the production of minivans. d. The price of sports utility vehicles...
(20 marks) Consider a perfectly competitive local market for retail gasoline fuel in Ontario for which...
 (20 marks) Consider a perfectly competitive local market for retail gasoline fuel in Ontario for which the demand side comprises 30,000 vehicles. Each gasoline firm in the market has an annual long-run total cost function of TC(q) = F +0.629 + 125,000,000 if q> 0 if q = 0 (TC(q) = 0 where F is fixed cost and q is firm-level output in litres of gasoline retailed per year. Each firm owns a single facility i.e. gas station), hires a...
Question 1 (10 pts) Consider the following market. Demand is given by Qp 5-P where Qp...
 Question 1 (10 pts) Consider the following market. Demand is given by Qp 5-P where Qp is the quantity demand and p is the price. Supply is given by Qs - F where Qs is the quantity supplied. a. What is the market equilibrium quantity and price? b. Calculate consumer, producer, and total surplus. Depict your answer in a graph. c. Suppose the government imposes a price floor of P- 4. Calculate the consumer surplus, producer surplus, and deadweight loss....
 (9 marks) Suppose the market for copper is represented by: Q = 5P2 - 200 Q = 1,300 - 10P2 Find the market equilibrium price and quantity. (2 marks) Find the price elasticity of demand at the equilibrium. Show your steps. (3 marks) Suppose there is a rise in the supply of copper in the market. Based on your result in (b), explain how the total sales revenue in the copper market will change. (4 marks)
 (10 marks) Suppose the market for apples is represented by: Supply: Demand: QP Q=36-3P Find the market cquilibrium price and quantity. (2 marks) b. Find the price elasticity of demand at the equilibrium. (3 marks) Suppose bad weather results in a poor harvest of apples. Using the price elasticity calculated in (b), explain its effect on the total revenue of the apple farmers (5 marks) S2 Assignment 1 v2.docx (9 marks) In December 2019, The Travel Industry Council of Hong...
 please help me with as much as you could
Calculus (4 marks) A firm estimates that the total revenue, SR(q), received from the sale of q goods is given by 5. R(x) = ln(1 + 1000 ) Calculate the marginal revenue when q = 10. Explain what this result means. 6, (3 marks) Consider the function f(x) = x3 + 2. (a) Sketch a graph of y-f(x) on I-1,2 (b) Estimate the area bounded by y-f(x), the x-axis and the...
please help me with as much as you could
Calculus (4 marks) A firm estimates that the total revenue, SR(q), received from the sale of q goods is given by 5. R(x) = ln(1 + 1000 ) Calculate the marginal revenue when q = 10. Explain what this result means. 6, (3 marks) Consider the function f(x) = x3 + 2. (a) Sketch a graph of y-f(x) on I-1,2 (b) Estimate the area bounded by y-f(x), the x-axis and the...
 2-Consider the market for minivans. For each of the events listed here, identity which of the determinants of demand or supply are affected. Also indicate whether demand or supply increases or decreases. Then draw a diagram to show the effect on the price and quantity of minivans. a. People decide to have more children. b. A strike by steelworkers raises steel prices. c. Engineers develop new automated machinery for the production of minivans. d. The price of sports utility vehicles...
 (20 marks) Consider a perfectly competitive local market for retail gasoline fuel in Ontario for which the demand side comprises 30,000 vehicles. Each gasoline firm in the market has an annual long-run total cost function of TC(q) = F +0.629 + 125,000,000 if q> 0 if q = 0 (TC(q) = 0 where F is fixed cost and q is firm-level output in litres of gasoline retailed per year. Each firm owns a single facility i.e. gas station), hires a...
 Question 1 (10 pts) Consider the following market. Demand is given by Qp 5-P where Qp is the quantity demand and p is the price. Supply is given by Qs - F where Qs is the quantity supplied. a. What is the market equilibrium quantity and price? b. Calculate consumer, producer, and total surplus. Depict your answer in a graph. c. Suppose the government imposes a price floor of P- 4. Calculate the consumer surplus, producer surplus, and deadweight loss....
Most questions answered within 3 hours.
-
Assume that the population of Mexico is 128
million and that the population increases 1.01
percentannually....
asked 6 minutes ago -
Can someone please help me add appropriate descriptive
comments to each line of code in the...
asked 12 minutes ago -
Romeo wishes to throw a bouquet of flowers to Juliet, who is on
a second-story balcony,...
asked 1 hour ago -
Why is QE a controversial monetary policy tool.
A. It may lead to excessive inflation.B. By...
asked 1 hour ago -
Principles of Programming midterm study guide help!
1.)
______ Which of the following would reference the...
asked 55 minutes ago -
A finite potential well has depth U0 = 2.78 eV . What is the
penetration distance...
asked 1 hour ago -
1. The bus bars of a power station are in two sections A and B
separated...
asked 1 hour ago -
Fiscal policy is the deliberate manipulation of taxes and
government spending to alter GDP, employment, inflation...
asked 2 hours ago -
evaluating an expression using only one digit and + and - as
operators ....3+5-1+7-5+8
-----------------------
stack...
asked 2 hours ago -
Two concentric current loops lie in the same plane. The smaller
loop has a radius of...
asked 3 hours ago -
1)Which of the following is an
important difference between qualified and nonqualified retirement
plans?
a. Qualified...
asked 3 hours ago -
What's the streaming business's problem on the
horizon?
asked 4 hours ago