


Homework Answers
Part 1
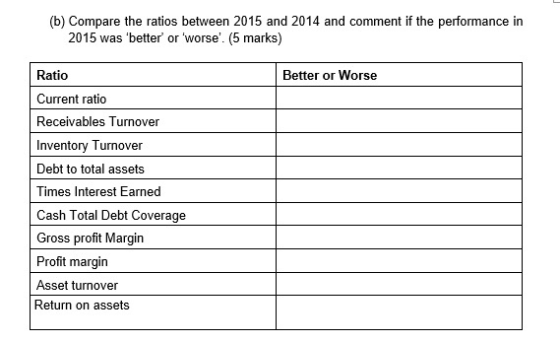
1. Current Ratio = current assets/ current liabilities
Current assets = cash+ account receivables+ inventory+ other current assets
2014 - 209000/56000 = 3.7:1
2015 - 273000/71500 = 3.8:1
2. Days sale outstanding = Account receivables/ Average sales per day
2014 - 95000/928000/365 = 37.36 days
2015 - 70000/840000/365 = 30.42 days
3. Days in Inventory = Inventory/ cost of goods sold x 365
2014 - 81000/478000 * 365 = 58 days
2015 - 71000/ 465000* 365 = 48.67 days
4. Debt to Total assets ratio = Total equity/ Total assets
2014 - 674500/991000 = 0.68:1
2015 - 499000/630000 = 0.79:1
5. Times Interest Earned Ratio - EBIT/ Total Interest
2014 - 126000/28500 = 4.42:1
2015 - 76000/ 107500 = 7.07:1
6. Cash total Debt Coverage Ratio - Cash from operation/ Debt
2014 - 120000/316500 = 0.38:1
2015 - 126000/131000 = 0.96:1
( Debt = total assets - equity)
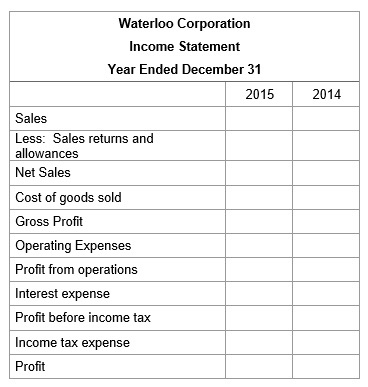
7. Gross Profit Margin - Gross profit/ Cost of Goods sold*100
2014 - 392000/478000*100 = 82%
2015 - 332000/465000*100= 71%
8. Profit Margin - Net Profit/ Net Sales*100
2014 - 76250/870000*100= 8.76%
2015 - 49000/797000*100 = 6.15%
9. Assets Turnover Ratio - Net sales/ Average Total Assets
2014 - 870000/810500 = 1.07:1
2015 - 797000/586000 = 1.36:1
10. Return on Assets - Net income/Average total assets
2014 - 76250/810500 = 0.09:1
2015 - 49000/586000 = 0.08:1
Add Answer to:
Part 1: Ratio Analysis calculate the following ratios
Part 2: Perform a vertical analysis of statement...
please help Waterloo Corporation Statement of Financial Position 31-Dec 2015 2014 2013 Assets Cash $32,000 $19,000...
 please help
Waterloo Corporation Statement of Financial Position 31-Dec 2015 2014 2013 Assets Cash $32,000 $19,000 $10,000 Accounts Receivable (net) 95,000 70,000 53,000 Inventory 81,000 71,000 53,000 Other current assets 65,000 49,000 61,000 Long-term investments 120,000 76,000 50,000 Property, Plant & Equipment (net) 598,000 345,000 315.000 Total Assets $991,000 $630,000 $542,000 $71,500 245.000 316,500 $56,000 75.000 131,000 $65,000 78,000 143,000 Liabilities & Shareholders' Equity Liabilities Current Liabilities Non-current liabilities Total Liabilities Shareholders' Equity Common Shares Retained Earnings Total Shareholders' Equity...
please help
Waterloo Corporation Statement of Financial Position 31-Dec 2015 2014 2013 Assets Cash $32,000 $19,000 $10,000 Accounts Receivable (net) 95,000 70,000 53,000 Inventory 81,000 71,000 53,000 Other current assets 65,000 49,000 61,000 Long-term investments 120,000 76,000 50,000 Property, Plant & Equipment (net) 598,000 345,000 315.000 Total Assets $991,000 $630,000 $542,000 $71,500 245.000 316,500 $56,000 75.000 131,000 $65,000 78,000 143,000 Liabilities & Shareholders' Equity Liabilities Current Liabilities Non-current liabilities Total Liabilities Shareholders' Equity Common Shares Retained Earnings Total Shareholders' Equity...
please do Waterloo Corporation Statement of Financial Position 31-Dec 2015 2014 2013 Assets Cash $32,000 $19,000...
 please do
Waterloo Corporation Statement of Financial Position 31-Dec 2015 2014 2013 Assets Cash $32,000 $19,000 $10,000 Accounts Receivable (net) 95,000 70,000 53,000 Inventory 81,000 71,000 53,000 Other current assets 65,000 49,000 61,000 Long-term investments 120,000 76,000 50,000 Property, Plant & Equipment (net) 598,000 345,000 315.000 Total Assets $991,000 $630,000 $542,000 $71,500 245.000 316,500 $56,000 75.000 131,000 $65,000 78,000 143,000 Liabilities & Shareholders' Equity Liabilities Current Liabilities Non-current liabilities Total Liabilities Shareholders' Equity Common Shares Retained Earnings Total Shareholders' Equity...
please do
Waterloo Corporation Statement of Financial Position 31-Dec 2015 2014 2013 Assets Cash $32,000 $19,000 $10,000 Accounts Receivable (net) 95,000 70,000 53,000 Inventory 81,000 71,000 53,000 Other current assets 65,000 49,000 61,000 Long-term investments 120,000 76,000 50,000 Property, Plant & Equipment (net) 598,000 345,000 315.000 Total Assets $991,000 $630,000 $542,000 $71,500 245.000 316,500 $56,000 75.000 131,000 $65,000 78,000 143,000 Liabilities & Shareholders' Equity Liabilities Current Liabilities Non-current liabilities Total Liabilities Shareholders' Equity Common Shares Retained Earnings Total Shareholders' Equity...
5. Calculate the 2015 financial ratios for Phocbe Corporation rounded to the nearest tenth and put...
 5. Calculate the 2015 financial ratios for Phocbe Corporation rounded to the nearest tenth and put a checkmark in tbe row in which Phorbe's ratios are better than the industry average: Ratio Gross Profit Margin Net Profit Margin Current Ratio Inventory Turnover Receivables Turnover Phoebe Corporation (2015) Industry Averages Phocbe is Better 55.0% 27.5% 3.3 % % 15.5 8.5 Select Financial Ratios What It Measures Eficiency of operations and product pricing Lisiency afher all expenses are considered Short-run debt-paying ability...
From the following financial statement calculate the following Ratios: Liquidity: a) Current Ratio b) Inventory Turnover...
 From the following financial statement calculate the following
Ratios:
Liquidity:
a) Current Ratio
b) Inventory Turnover
Solvency:
c) Debt to Total Assets Ratio
d) Times Interest Earned Ratio
Profitability:
e) Return on Assets
f) Profit Margin
9 Selected Statement of Financial Position Information 2019 ($'000) 2018 ($'000) 10 11 Cash and Cash Equivalents 12 Trade Receivables 13 Inventories 14 Total Current Assets 15 Total Assets 16 Total Current Liabilities 17 Total Liabilities 18 Retained Earnings 19 Shareholders Equity 20 21...
From the following financial statement calculate the following
Ratios:
Liquidity:
a) Current Ratio
b) Inventory Turnover
Solvency:
c) Debt to Total Assets Ratio
d) Times Interest Earned Ratio
Profitability:
e) Return on Assets
f) Profit Margin
9 Selected Statement of Financial Position Information 2019 ($'000) 2018 ($'000) 10 11 Cash and Cash Equivalents 12 Trade Receivables 13 Inventories 14 Total Current Assets 15 Total Assets 16 Total Current Liabilities 17 Total Liabilities 18 Retained Earnings 19 Shareholders Equity 20 21...
Question 1 The comparative data from the statement of financial position of Azam Berhad at 31...
 Question 1 The comparative data from the statement of financial position of Azam Berhad at 31 December, 2016 and 2017 are as follows. Comparative data on current assets and current liabilities at 31 December 2017 I 2017 2016 I RM RM Current Assets Inventories 454.500 ||490.200 Accounts receivable I 174.100 1190.750 Prepaid expenses 17.100 119.200 Cash and cash equivalents T136.500 17.550 Current Liabilities Accounts payable Short-term bank loan 11117,450 ||123.450 117.250 III.250 Statement of profit or loss for the year...
Problem 14-5A Condensed statement of financial position and income statement data for Speedway Corporation follow: 2016...
 Problem 14-5A Condensed statement of financial position and income statement data for Speedway Corporation follow: 2016 $17,900 48,100 63,700 129,700 SPEEDWAY CORPORATION Statement of Financial Position December 31 2018 2017 Assets Current assets Cash $25,200 $20,100 Accounts receivable (net) 55,300 45,300 Inventory 100,000 85,100 Total current assets 180,500 150,500 Long-term investments 57,500 69,700 Property, plant, and equipment (net) 498,900 371,800 Total assets $736,900 $592,000 Liabilities and Shareholders' Equity Liabilities Current liabilities $85,700 $79,600 Non-current liabilities 155,700 85,400 Total liabilities 241,400...
Show step by step working claculations Income Statement compared with Industry Average For the year ended 30th June 201...
 Show step by step working claculations
Income Statement compared with Industry Average For the year ended 30th June 2016 Peters Industry Average 100.0% Net sales $972,500 Cost of sales 653.520 65.8 34.2 Gross profit Selling and general expenses Other expenses Profit 318,980 201,308 5.835 19.7 04 Peters Retailers Pty Statement of financial Position compared with Industry Average as at 30h June 2016 Peters Industry Average $406,800 70.9% 151,200 23.6 0.8 Current assets Property, plant and equipment, net Intangible assets, net...
Show step by step working claculations
Income Statement compared with Industry Average For the year ended 30th June 2016 Peters Industry Average 100.0% Net sales $972,500 Cost of sales 653.520 65.8 34.2 Gross profit Selling and general expenses Other expenses Profit 318,980 201,308 5.835 19.7 04 Peters Retailers Pty Statement of financial Position compared with Industry Average as at 30h June 2016 Peters Industry Average $406,800 70.9% 151,200 23.6 0.8 Current assets Property, plant and equipment, net Intangible assets, net...
2015 to compare 4-9. (Ratio analysis) The financial statements and industry norms are shown be for...
 2015 to compare 4-9. (Ratio analysis) The financial statements and industry norms are shown be for Pamplin, Inc.: a. Compute the financial ratios for Pamplin for 2014 and for 2015 to com both against the industry norms. b. How liquid is the firm? c. Areits managers generating an adequate operating profit on the firm's d. How is the firm financing its assets? e. Are its managers generating a good return on equity? INDUSTRY NORN 5.00 3.00 2.20 90.00 0.33 Current...
PROBLEM 1-8 Financial Statement Ratio Analysis The balance sheet and income statement for Chico Electronics are...
 PROBLEM 1-8 Financial Statement Ratio Analysis The balance sheet and income statement for Chico Electronics are reproduced below (tax rate is 40%) CHICO ELECTRONICS Balance Sheet($thousands) As of December 31 Year 4 Year 5 $ 683 1.490 1,415 $ 325 3,599 2,423 13 6,360 1,541 $8,058 $ 875 116 Assets Current assets Cash Accounts receivable.. Inventories.......... Prepaid expenses ........ Total current assets ....... Property, plant and equipment, net. Other assets.. Total assets .... . Liabilities and Shareholders' Equity Current liabilities...
Use the following financial statement information for Stowe Enterprises to solve Prob- lems 2A.4 through 2A.7:...
 Use the following financial statement information for Stowe Enterprises to solve Prob- lems 2A.4 through 2A.7: STOWE ENTERPRISES Statement of Comprehensive Income $4,500 2,400 500 Earnings before interest and taxes $1,600 480 $1,120 380 S 740 $ 186 554 2015 Sales Cost of goods sold Depreciation Interest paid Taxable income Taxes Net income Addition to retained earnings Dividends STOWE ENTER PRISES Abbreviated Statement of Financial Position, 2014-2015 2014 2015 Liabilities and 2014 2015 Assets shareholders' equity Current liabilities Current assets...
 please help
Waterloo Corporation Statement of Financial Position 31-Dec 2015 2014 2013 Assets Cash $32,000 $19,000 $10,000 Accounts Receivable (net) 95,000 70,000 53,000 Inventory 81,000 71,000 53,000 Other current assets 65,000 49,000 61,000 Long-term investments 120,000 76,000 50,000 Property, Plant & Equipment (net) 598,000 345,000 315.000 Total Assets $991,000 $630,000 $542,000 $71,500 245.000 316,500 $56,000 75.000 131,000 $65,000 78,000 143,000 Liabilities & Shareholders' Equity Liabilities Current Liabilities Non-current liabilities Total Liabilities Shareholders' Equity Common Shares Retained Earnings Total Shareholders' Equity...
please help
Waterloo Corporation Statement of Financial Position 31-Dec 2015 2014 2013 Assets Cash $32,000 $19,000 $10,000 Accounts Receivable (net) 95,000 70,000 53,000 Inventory 81,000 71,000 53,000 Other current assets 65,000 49,000 61,000 Long-term investments 120,000 76,000 50,000 Property, Plant & Equipment (net) 598,000 345,000 315.000 Total Assets $991,000 $630,000 $542,000 $71,500 245.000 316,500 $56,000 75.000 131,000 $65,000 78,000 143,000 Liabilities & Shareholders' Equity Liabilities Current Liabilities Non-current liabilities Total Liabilities Shareholders' Equity Common Shares Retained Earnings Total Shareholders' Equity...
 please do
Waterloo Corporation Statement of Financial Position 31-Dec 2015 2014 2013 Assets Cash $32,000 $19,000 $10,000 Accounts Receivable (net) 95,000 70,000 53,000 Inventory 81,000 71,000 53,000 Other current assets 65,000 49,000 61,000 Long-term investments 120,000 76,000 50,000 Property, Plant & Equipment (net) 598,000 345,000 315.000 Total Assets $991,000 $630,000 $542,000 $71,500 245.000 316,500 $56,000 75.000 131,000 $65,000 78,000 143,000 Liabilities & Shareholders' Equity Liabilities Current Liabilities Non-current liabilities Total Liabilities Shareholders' Equity Common Shares Retained Earnings Total Shareholders' Equity...
please do
Waterloo Corporation Statement of Financial Position 31-Dec 2015 2014 2013 Assets Cash $32,000 $19,000 $10,000 Accounts Receivable (net) 95,000 70,000 53,000 Inventory 81,000 71,000 53,000 Other current assets 65,000 49,000 61,000 Long-term investments 120,000 76,000 50,000 Property, Plant & Equipment (net) 598,000 345,000 315.000 Total Assets $991,000 $630,000 $542,000 $71,500 245.000 316,500 $56,000 75.000 131,000 $65,000 78,000 143,000 Liabilities & Shareholders' Equity Liabilities Current Liabilities Non-current liabilities Total Liabilities Shareholders' Equity Common Shares Retained Earnings Total Shareholders' Equity...
 5. Calculate the 2015 financial ratios for Phocbe Corporation rounded to the nearest tenth and put a checkmark in tbe row in which Phorbe's ratios are better than the industry average: Ratio Gross Profit Margin Net Profit Margin Current Ratio Inventory Turnover Receivables Turnover Phoebe Corporation (2015) Industry Averages Phocbe is Better 55.0% 27.5% 3.3 % % 15.5 8.5 Select Financial Ratios What It Measures Eficiency of operations and product pricing Lisiency afher all expenses are considered Short-run debt-paying ability...
 From the following financial statement calculate the following
Ratios:
Liquidity:
a) Current Ratio
b) Inventory Turnover
Solvency:
c) Debt to Total Assets Ratio
d) Times Interest Earned Ratio
Profitability:
e) Return on Assets
f) Profit Margin
9 Selected Statement of Financial Position Information 2019 ($'000) 2018 ($'000) 10 11 Cash and Cash Equivalents 12 Trade Receivables 13 Inventories 14 Total Current Assets 15 Total Assets 16 Total Current Liabilities 17 Total Liabilities 18 Retained Earnings 19 Shareholders Equity 20 21...
From the following financial statement calculate the following
Ratios:
Liquidity:
a) Current Ratio
b) Inventory Turnover
Solvency:
c) Debt to Total Assets Ratio
d) Times Interest Earned Ratio
Profitability:
e) Return on Assets
f) Profit Margin
9 Selected Statement of Financial Position Information 2019 ($'000) 2018 ($'000) 10 11 Cash and Cash Equivalents 12 Trade Receivables 13 Inventories 14 Total Current Assets 15 Total Assets 16 Total Current Liabilities 17 Total Liabilities 18 Retained Earnings 19 Shareholders Equity 20 21...
 Question 1 The comparative data from the statement of financial position of Azam Berhad at 31 December, 2016 and 2017 are as follows. Comparative data on current assets and current liabilities at 31 December 2017 I 2017 2016 I RM RM Current Assets Inventories 454.500 ||490.200 Accounts receivable I 174.100 1190.750 Prepaid expenses 17.100 119.200 Cash and cash equivalents T136.500 17.550 Current Liabilities Accounts payable Short-term bank loan 11117,450 ||123.450 117.250 III.250 Statement of profit or loss for the year...
 Problem 14-5A Condensed statement of financial position and income statement data for Speedway Corporation follow: 2016 $17,900 48,100 63,700 129,700 SPEEDWAY CORPORATION Statement of Financial Position December 31 2018 2017 Assets Current assets Cash $25,200 $20,100 Accounts receivable (net) 55,300 45,300 Inventory 100,000 85,100 Total current assets 180,500 150,500 Long-term investments 57,500 69,700 Property, plant, and equipment (net) 498,900 371,800 Total assets $736,900 $592,000 Liabilities and Shareholders' Equity Liabilities Current liabilities $85,700 $79,600 Non-current liabilities 155,700 85,400 Total liabilities 241,400...
 Show step by step working claculations
Income Statement compared with Industry Average For the year ended 30th June 2016 Peters Industry Average 100.0% Net sales $972,500 Cost of sales 653.520 65.8 34.2 Gross profit Selling and general expenses Other expenses Profit 318,980 201,308 5.835 19.7 04 Peters Retailers Pty Statement of financial Position compared with Industry Average as at 30h June 2016 Peters Industry Average $406,800 70.9% 151,200 23.6 0.8 Current assets Property, plant and equipment, net Intangible assets, net...
Show step by step working claculations
Income Statement compared with Industry Average For the year ended 30th June 2016 Peters Industry Average 100.0% Net sales $972,500 Cost of sales 653.520 65.8 34.2 Gross profit Selling and general expenses Other expenses Profit 318,980 201,308 5.835 19.7 04 Peters Retailers Pty Statement of financial Position compared with Industry Average as at 30h June 2016 Peters Industry Average $406,800 70.9% 151,200 23.6 0.8 Current assets Property, plant and equipment, net Intangible assets, net...
 2015 to compare 4-9. (Ratio analysis) The financial statements and industry norms are shown be for Pamplin, Inc.: a. Compute the financial ratios for Pamplin for 2014 and for 2015 to com both against the industry norms. b. How liquid is the firm? c. Areits managers generating an adequate operating profit on the firm's d. How is the firm financing its assets? e. Are its managers generating a good return on equity? INDUSTRY NORN 5.00 3.00 2.20 90.00 0.33 Current...
 PROBLEM 1-8 Financial Statement Ratio Analysis The balance sheet and income statement for Chico Electronics are reproduced below (tax rate is 40%) CHICO ELECTRONICS Balance Sheet($thousands) As of December 31 Year 4 Year 5 $ 683 1.490 1,415 $ 325 3,599 2,423 13 6,360 1,541 $8,058 $ 875 116 Assets Current assets Cash Accounts receivable.. Inventories.......... Prepaid expenses ........ Total current assets ....... Property, plant and equipment, net. Other assets.. Total assets .... . Liabilities and Shareholders' Equity Current liabilities...
 Use the following financial statement information for Stowe Enterprises to solve Prob- lems 2A.4 through 2A.7: STOWE ENTERPRISES Statement of Comprehensive Income $4,500 2,400 500 Earnings before interest and taxes $1,600 480 $1,120 380 S 740 $ 186 554 2015 Sales Cost of goods sold Depreciation Interest paid Taxable income Taxes Net income Addition to retained earnings Dividends STOWE ENTER PRISES Abbreviated Statement of Financial Position, 2014-2015 2014 2015 Liabilities and 2014 2015 Assets shareholders' equity Current liabilities Current assets...
Most questions answered within 3 hours.
-
C++ program
Correctly complete the following assignment. Follow all
directions. The main purpose is to show...
asked 6 minutes ago -
A demand curve will shift inward for any of the following
reasons except that:
a.
income...
asked 5 minutes ago -
2-Many programming languages facilitate programming in more than
one paradigm.
TRUE OR FALSE
3-If a language...
asked 8 minutes ago -
what is the name of the uppermost rock unit "formation" that
underlies Saginaw, mi? This assignment...
asked 15 minutes ago -
What is a good infrastructure recommendation for communications
networks in Hong Kong?
asked 17 minutes ago -
A string is wrapped around a drum that has a radius of 3 cm. If
a...
asked 23 minutes ago -
what applied force is needed to accelerate 50kg at 2m/s^2 if
the friction force is 200
asked 27 minutes ago -
A survey found that the American family generates an average of
17.2 pounds of glass garbage...
asked 35 minutes ago -
Help Please!
Runyan voluntarily petitions for bankruptcy. He has three major
claims against his estate. One...
asked 29 minutes ago -
Key Themes for the study of Islam
Chapter 9: God
In 833 CE, the caliph Al-Ma'mun...
asked 37 minutes ago -
Please, i need Unique answer, Use your own words (don't copy and
paste). *Please, don't use...
asked 1 hour ago -
In 2018 Lamborghini was quite concerned with pricing the new
Lambo, the Lambo Centenario. The manager...
asked 44 minutes ago