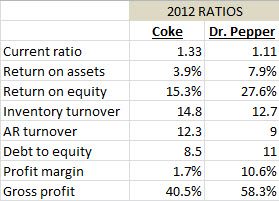
The ratios for Coke and Dr. Pepper for 2012 are shown above. Which ratio shows COKE as STRONGER than DR PEPPER?
gross profit, return on asset ,return of equity or debt of equity
Homework Answers
Solution :- Ratio Analysis
1. Gross Profit :-
Gross Profit Ratio = Gross profit / Total Sales *100
Gross profit ratio shows how much gross profit company earns on total sales ,Therefore Higher this ratio is , Better it is. Gross Profit Ratio of DR. Pepper (58.3%) is more than gross Profit Ratio of Coke (40.5%) , Therefore , Gross Profit Ratio shows DR PEPPER as stronger than COKE.
2. Return on Assets :-
Return on Asset = Net Income / Average Total Assets
Return on Asset shows net income earned by a company during a period from its assets ,Therefore Higher this ratio is , Better it is. Return on Asset Ratio of DR. Pepper (7.9%) is more than Return on Asset Ratio of Coke (3.9%) , Therefore , Return on Asset Ratio shows DR PEPPER as stronger than COKE.
3. Return on Equity :-
Return on Equity = Net Income / Shareholders Equity
Return on Equity shows the ability of a company to earn net income from its Shareholders funds , Therefore Higher this ratio is , Better it is. Return on Equity Ratio of DR. Pepper (27.6%) is more than Return on Equity Ratio of Coke (15.3%) , Therefore , Return on Equity Ratio shows DR PEPPER as stronger than COKE.
4. Debt to Equity :-
Debt to Equity = Total Liabilities /Total Shareholders Equity
A lower debt to equity ratio shows a more financially stable business. Therefore LOWER this ratio is , Better it is.Debt to Equity Ratio of DR. Pepper (11) is more than Debt to Equity Ratio of Coke (8.5) , Therefore ,Debt to Equity Ratio shows COKE as stronger than DR PEPPER because COKE has lower debt equity ratio which shows it is more financially stable than DR. Pepper.
Add Answer to:
The ratios for Coke and Dr. Pepper for 2012 are shown above.
Which ratio shows COKE...
The ratios for Coke and Dr. Pepper for 2012 are shown above. Which ratio shows signs...
The ratios for Coke and Dr. Pepper for 2012 are shown above. Which ratio shows signs of poor financial health for COKE? Current ratio Return on assets Return on equity Inventory turnover AR turnover Debt to equity Profit margin Gross profit 2012 RATIOS Coke Dr. Pepper 1.33 1.11 3.9% 7.9% 15.3% 27.6% 14.8 12.7 12.3 8.5 11 1.7% 10.6% 40.5% 58.3%
The ratios for Coke and Dr. Pepper for 2012 are shown above. Which ratio shows signs...
The ratios for Coke and Dr. Pepper for 2012 are shown above. Which ratio shows signs of poorfinancial health for COKE? Question 1 options: Current ratio Return on Assets Inventory Turnover AR Turnover Current ratio Return on assets Return on equity Inventory turnover AR turnover Debt to equity Profit margin Gross profit 2012 RATIOS Coke Dr. Pepper 1.33 1.11 3.9% 7.9% 15.3% 27.6% 14.8 12.7 12.3 8.5 11 1.7% 10.6% 40.5% 58.3%
Current ratio Return on assets Return on equity Inventory turnover AR turnover Debt to equity Profit...
 Current ratio Return on assets Return on equity Inventory turnover AR turnover Debt to equity Profit margin Gross profit 2012 RATIOS Coke Dr. Pepper 1.33 1.11 3.9% 7.9% 15.3% 27.6% 14.8 12.7 12.3 8.5 11 1.7% 10.6% 40.5% 58.3% The ratios for Coke and Dr. Pepper for 2012 are shown above. Which ratios show signs of poor financial health for DR PEPPER? Current ratio Return on Assets II Return on Equity Debt to Equity
Complete Assurance of Learning Exercise 4C: Financial Ratio Analysis for PepsiCo. Financial Ratios for PepsiCo (2012)...
 Complete Assurance of Learning Exercise 4C: Financial Ratio
Analysis for PepsiCo.
Financial Ratios for PepsiCo (2012) use the below information to
find
Liquidity Ratios:
- Current ratio:
- Quick ratio:
Leverage Ratios:
- Debt-to-total-assets ratio:
- Debt-to-equity ratio:
- Long-term debt-to-equity ratio:
- Times-earned-interest ratio: Profits before interest and
taxes/Total interest charges
Activity Ratios:
- Inventory turnover:
- Fixed assets turnover:
- Total assets turnover:
- Accounts receivable turnover:
Profitability Ratios:
- Gross profit margin:
- Operating profit margin:
-...
Complete Assurance of Learning Exercise 4C: Financial Ratio
Analysis for PepsiCo.
Financial Ratios for PepsiCo (2012) use the below information to
find
Liquidity Ratios:
- Current ratio:
- Quick ratio:
Leverage Ratios:
- Debt-to-total-assets ratio:
- Debt-to-equity ratio:
- Long-term debt-to-equity ratio:
- Times-earned-interest ratio: Profits before interest and
taxes/Total interest charges
Activity Ratios:
- Inventory turnover:
- Fixed assets turnover:
- Total assets turnover:
- Accounts receivable turnover:
Profitability Ratios:
- Gross profit margin:
- Operating profit margin:
-...
6 Which financial leverage ratio is used with two other ratios to mathematically produce the return...
 6 Which financial leverage ratio is used with two other ratios to mathematically produce the return on equity ratio? Debt/ Equity Total Liabilities/(Equity - Intangible Assets) Total Assets/ Equity Total Liabilities/Equity 17 Which of the following is a tertiary ratio that drives profitability? SG&A Expense/Sales Net Profit/Sales EBIT /Sales EBIT /Net Profit 18 Which ratios indicate how efficiently the company is in generating sales from the company's assets? Net profit ratio Solvency ratio Quick asset ratio Working capital turnover 19...
PA13-5 Interpreting Profitability, Liquidity, Solvency, and P/E Ratlos [LO4, L05] Coke and Pepsi are well-known international...
 PA13-5 Interpreting Profitability, Liquidity, Solvency, and P/E Ratlos [LO4, L05] Coke and Pepsi are well-known international brands. Coca-Cola sells more than $35 billion worth of beverages each year while annual sales of Pepsi products exceed $43 billion. Compare the two companies as a potential investment based on the following ratios: Coca PepsiCo Cola Pepsico Ratio Gross profit percentage Net profit margin Return on equity EPS Receivables turnover ratio Inventory turnover ratio Current ratio Debt-to-assets P/E ratio 63.9% 33.6% 37.7% $5.06...
Indicate what is meant by the following ratio calculations. 1. Liquidity Ratios Current Ratio = Current...
Indicate what is meant by the following ratio calculations. 1. Liquidity Ratios Current Ratio = Current Assets Current Liabilities = 515800 626900 = 0.82 : 1 Quick Ratio = Quick Assets Current Liabilities = 42700 + 205800 626900 = 0.40 Cash Ratio = Cash & Cash Equivalents Current Liabilities = 42700 626900 = 0.0681 : 1 2. Turnover / Activity Ratios Inventory Turnover = COGS Average Inventories...
Prepare ratio analyses (for the three year time period). You will compute the following ratios: Profitability...
 Prepare ratio analyses (for the three
year time period). You will compute the following ratios:
Profitability ratios:
Gross Profit margin
Operating expense margin
Profit margin
Return on assets
Return on equity
Productivity ratios:
Accounts Receivable Turnover
Days Sales Outstanding
Inventory Turnover
Days inventory outstanding
Accounts Payable turnover
Days payable outstanding
Cash Conversion Cycle
PPE Turnover
Coverage ratios:
Total liabilities-to-equity
Total debt to equity
Cash from operations to total debt
Times interest earned
Liquidity ratios:
Current Ratio
Quick Ratio
We were...
Prepare ratio analyses (for the three
year time period). You will compute the following ratios:
Profitability ratios:
Gross Profit margin
Operating expense margin
Profit margin
Return on assets
Return on equity
Productivity ratios:
Accounts Receivable Turnover
Days Sales Outstanding
Inventory Turnover
Days inventory outstanding
Accounts Payable turnover
Days payable outstanding
Cash Conversion Cycle
PPE Turnover
Coverage ratios:
Total liabilities-to-equity
Total debt to equity
Cash from operations to total debt
Times interest earned
Liquidity ratios:
Current Ratio
Quick Ratio
We were...
*Calculate all liqudity, debt, activity, and profitability ratios that are found on the table showing a...
 *Calculate all liqudity, debt, activity, and profitability ratios that are found on the table showing a list of Industry Averages for the firm. This is found beneath the firm's income statement. Please note that the balance sheet is found on the next page. Show all of your calculations. *Complete a cross-sectional analysis by comparing the firm's ratios compared to the industry averages. Use financial terminology and proper English including complete sentences. Cross-sectional ratio analysis Use the financial statements below and...
ey Ratio Calculations 5 1. Create a single sheet that calculates the ratios listed below based...
 ey Ratio Calculations 5 1. Create a single sheet that calculates the ratios listed below based on the financial statement 2. Please see Demo 1E for suggestions on how to complete this exercise (the ratios demo may not be 6 exactly the same for this assignment. Please make sure to include the ratios listed HERE: a. Ratios: Current, Quick, Inventory Turnover, Average Collection Period, Fixed Assets Turnover Total Asset Turnover, Debt Ratio, Debt to Equity, Times Interest Earned, Gross Profit...
 Current ratio Return on assets Return on equity Inventory turnover AR turnover Debt to equity Profit margin Gross profit 2012 RATIOS Coke Dr. Pepper 1.33 1.11 3.9% 7.9% 15.3% 27.6% 14.8 12.7 12.3 8.5 11 1.7% 10.6% 40.5% 58.3% The ratios for Coke and Dr. Pepper for 2012 are shown above. Which ratios show signs of poor financial health for DR PEPPER? Current ratio Return on Assets II Return on Equity Debt to Equity
 Complete Assurance of Learning Exercise 4C: Financial Ratio
Analysis for PepsiCo.
Financial Ratios for PepsiCo (2012) use the below information to
find
Liquidity Ratios:
- Current ratio:
- Quick ratio:
Leverage Ratios:
- Debt-to-total-assets ratio:
- Debt-to-equity ratio:
- Long-term debt-to-equity ratio:
- Times-earned-interest ratio: Profits before interest and
taxes/Total interest charges
Activity Ratios:
- Inventory turnover:
- Fixed assets turnover:
- Total assets turnover:
- Accounts receivable turnover:
Profitability Ratios:
- Gross profit margin:
- Operating profit margin:
-...
Complete Assurance of Learning Exercise 4C: Financial Ratio
Analysis for PepsiCo.
Financial Ratios for PepsiCo (2012) use the below information to
find
Liquidity Ratios:
- Current ratio:
- Quick ratio:
Leverage Ratios:
- Debt-to-total-assets ratio:
- Debt-to-equity ratio:
- Long-term debt-to-equity ratio:
- Times-earned-interest ratio: Profits before interest and
taxes/Total interest charges
Activity Ratios:
- Inventory turnover:
- Fixed assets turnover:
- Total assets turnover:
- Accounts receivable turnover:
Profitability Ratios:
- Gross profit margin:
- Operating profit margin:
-...
 6 Which financial leverage ratio is used with two other ratios to mathematically produce the return on equity ratio? Debt/ Equity Total Liabilities/(Equity - Intangible Assets) Total Assets/ Equity Total Liabilities/Equity 17 Which of the following is a tertiary ratio that drives profitability? SG&A Expense/Sales Net Profit/Sales EBIT /Sales EBIT /Net Profit 18 Which ratios indicate how efficiently the company is in generating sales from the company's assets? Net profit ratio Solvency ratio Quick asset ratio Working capital turnover 19...
 PA13-5 Interpreting Profitability, Liquidity, Solvency, and P/E Ratlos [LO4, L05] Coke and Pepsi are well-known international brands. Coca-Cola sells more than $35 billion worth of beverages each year while annual sales of Pepsi products exceed $43 billion. Compare the two companies as a potential investment based on the following ratios: Coca PepsiCo Cola Pepsico Ratio Gross profit percentage Net profit margin Return on equity EPS Receivables turnover ratio Inventory turnover ratio Current ratio Debt-to-assets P/E ratio 63.9% 33.6% 37.7% $5.06...
 Prepare ratio analyses (for the three
year time period). You will compute the following ratios:
Profitability ratios:
Gross Profit margin
Operating expense margin
Profit margin
Return on assets
Return on equity
Productivity ratios:
Accounts Receivable Turnover
Days Sales Outstanding
Inventory Turnover
Days inventory outstanding
Accounts Payable turnover
Days payable outstanding
Cash Conversion Cycle
PPE Turnover
Coverage ratios:
Total liabilities-to-equity
Total debt to equity
Cash from operations to total debt
Times interest earned
Liquidity ratios:
Current Ratio
Quick Ratio
We were...
Prepare ratio analyses (for the three
year time period). You will compute the following ratios:
Profitability ratios:
Gross Profit margin
Operating expense margin
Profit margin
Return on assets
Return on equity
Productivity ratios:
Accounts Receivable Turnover
Days Sales Outstanding
Inventory Turnover
Days inventory outstanding
Accounts Payable turnover
Days payable outstanding
Cash Conversion Cycle
PPE Turnover
Coverage ratios:
Total liabilities-to-equity
Total debt to equity
Cash from operations to total debt
Times interest earned
Liquidity ratios:
Current Ratio
Quick Ratio
We were...
 *Calculate all liqudity, debt, activity, and profitability ratios that are found on the table showing a list of Industry Averages for the firm. This is found beneath the firm's income statement. Please note that the balance sheet is found on the next page. Show all of your calculations. *Complete a cross-sectional analysis by comparing the firm's ratios compared to the industry averages. Use financial terminology and proper English including complete sentences. Cross-sectional ratio analysis Use the financial statements below and...
 ey Ratio Calculations 5 1. Create a single sheet that calculates the ratios listed below based on the financial statement 2. Please see Demo 1E for suggestions on how to complete this exercise (the ratios demo may not be 6 exactly the same for this assignment. Please make sure to include the ratios listed HERE: a. Ratios: Current, Quick, Inventory Turnover, Average Collection Period, Fixed Assets Turnover Total Asset Turnover, Debt Ratio, Debt to Equity, Times Interest Earned, Gross Profit...
Most questions answered within 3 hours.
-
. For this set of questions, determine what
proportion of a normal distribution is located betweeneach...
asked 17 minutes ago -
A college student is employed as a door-to-door newspaper
salesman. Historical data suggests that the student...
asked 1 hour ago -
MATLAB HW 11 problem using Switch Case and Input commands
Write a script file that calculates...
asked 56 minutes ago -
Considering gravitational time dilation, calculate the time that
passes in Earth’s surface while 1 hour passes...
asked 1 hour ago -
Minitab Problem: Take the Lake Hume June rainfall data and find
use the processes outlined in...
asked 2 hours ago -
X Company is trying to decide whether to continue using old
equipment to make Product A...
asked 2 hours ago -
IN PYTHON ONLY !! Program 2: Re-work
program #5 (WeeklyHours) from the previous assignment such that...
asked 3 hours ago -
The average length of time between arrivals at a turnpike
toll-booth is 26 seconds. What is...
asked 4 hours ago -
(a) A piston at 6.1 atm contains a gas that occupies a volume of
3.5 L....
asked 5 hours ago -
Please answer true or false. Words
cannot be changed or added in to make it true...
asked 5 hours ago -
An empty test tube weighs 15.923 grams. Then,
MgCl2•6H2O is added into the test tube. After...
asked 5 hours ago -
Assume memory access is 10 units of time and disk access is
10000 units of time....
asked 6 hours ago