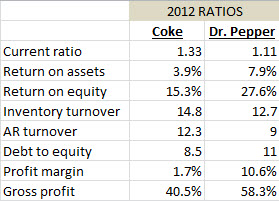
The ratios for Coke and Dr. Pepper for 2012 are shown above. Which ratio shows signs of poor financial health for COKE?
Homework Answers
Through our analysis we found that the following ratio shows signs of poor financial health for COKE is -
Debt to Equity ratio because ideal debt equity ratio for any business organisation is 2:1 i.e. debt should not be more than two times of equity. If proportion of debt increases in our capital than our interest liability increases which is very harmful for our organisation.
Debt Equity ratio of COKE is 8.5 : 1. Hence, it shows poor financial health.
Add Answer to:
The ratios for Coke and Dr. Pepper for 2012 are shown above.
Which ratio shows signs...
The ratios for Coke and Dr. Pepper for 2012 are shown above. Which ratio shows COKE...
The ratios for Coke and Dr. Pepper for 2012 are shown above. Which ratio shows COKE as STRONGER than DR PEPPER? gross profit, return on asset ,return of equity or debt of equity Current ratio Return on assets Return on equity Inventory turnover AR turnover Debt to equity Profit margin Gross profit 2012 RATIOS Coke Dr. Pepper 1.33 1.11 3.9% 7.9% 15.3% 27.6% 14.8 12.7 12.3 8.5 11 1.7% 10.6% 40.5% 58.3%
The ratios for Coke and Dr. Pepper for 2012 are shown above. Which ratio shows signs...
The ratios for Coke and Dr. Pepper for 2012 are shown above. Which ratio shows signs of poorfinancial health for COKE? Question 1 options: Current ratio Return on Assets Inventory Turnover AR Turnover Current ratio Return on assets Return on equity Inventory turnover AR turnover Debt to equity Profit margin Gross profit 2012 RATIOS Coke Dr. Pepper 1.33 1.11 3.9% 7.9% 15.3% 27.6% 14.8 12.7 12.3 8.5 11 1.7% 10.6% 40.5% 58.3%
Current ratio Return on assets Return on equity Inventory turnover AR turnover Debt to equity Profit...
 Current ratio Return on assets Return on equity Inventory turnover AR turnover Debt to equity Profit margin Gross profit 2012 RATIOS Coke Dr. Pepper 1.33 1.11 3.9% 7.9% 15.3% 27.6% 14.8 12.7 12.3 8.5 11 1.7% 10.6% 40.5% 58.3% The ratios for Coke and Dr. Pepper for 2012 are shown above. Which ratios show signs of poor financial health for DR PEPPER? Current ratio Return on Assets II Return on Equity Debt to Equity
Complete Assurance of Learning Exercise 4C: Financial Ratio Analysis for PepsiCo. Financial Ratios for PepsiCo (2012)...
 Complete Assurance of Learning Exercise 4C: Financial Ratio
Analysis for PepsiCo.
Financial Ratios for PepsiCo (2012) use the below information to
find
Liquidity Ratios:
- Current ratio:
- Quick ratio:
Leverage Ratios:
- Debt-to-total-assets ratio:
- Debt-to-equity ratio:
- Long-term debt-to-equity ratio:
- Times-earned-interest ratio: Profits before interest and
taxes/Total interest charges
Activity Ratios:
- Inventory turnover:
- Fixed assets turnover:
- Total assets turnover:
- Accounts receivable turnover:
Profitability Ratios:
- Gross profit margin:
- Operating profit margin:
-...
Complete Assurance of Learning Exercise 4C: Financial Ratio
Analysis for PepsiCo.
Financial Ratios for PepsiCo (2012) use the below information to
find
Liquidity Ratios:
- Current ratio:
- Quick ratio:
Leverage Ratios:
- Debt-to-total-assets ratio:
- Debt-to-equity ratio:
- Long-term debt-to-equity ratio:
- Times-earned-interest ratio: Profits before interest and
taxes/Total interest charges
Activity Ratios:
- Inventory turnover:
- Fixed assets turnover:
- Total assets turnover:
- Accounts receivable turnover:
Profitability Ratios:
- Gross profit margin:
- Operating profit margin:
-...
6 Which financial leverage ratio is used with two other ratios to mathematically produce the return...
 6 Which financial leverage ratio is used with two other ratios to mathematically produce the return on equity ratio? Debt/ Equity Total Liabilities/(Equity - Intangible Assets) Total Assets/ Equity Total Liabilities/Equity 17 Which of the following is a tertiary ratio that drives profitability? SG&A Expense/Sales Net Profit/Sales EBIT /Sales EBIT /Net Profit 18 Which ratios indicate how efficiently the company is in generating sales from the company's assets? Net profit ratio Solvency ratio Quick asset ratio Working capital turnover 19...
PA13-5 Interpreting Profitability, Liquidity, Solvency, and P/E Ratlos [LO4, L05] Coke and Pepsi are well-known international...
 PA13-5 Interpreting Profitability, Liquidity, Solvency, and P/E Ratlos [LO4, L05] Coke and Pepsi are well-known international brands. Coca-Cola sells more than $35 billion worth of beverages each year while annual sales of Pepsi products exceed $43 billion. Compare the two companies as a potential investment based on the following ratios: Coca PepsiCo Cola Pepsico Ratio Gross profit percentage Net profit margin Return on equity EPS Receivables turnover ratio Inventory turnover ratio Current ratio Debt-to-assets P/E ratio 63.9% 33.6% 37.7% $5.06...
Calculate the following ratios for 2012 and show the steps involved: a) Inventory turnover ratio b)...
 Calculate the following ratios for 2012 and show the steps
involved:
a) Inventory turnover ratio
b) average days in inventory
c) receivables turnover ratio
d) average collection period
e) asset turnover ratio
f) profit margin on sales
g) return on assets
h) return on shareholders equity
i) equity multiplier
j) return on shareholders equity using the Du Port framework
Note: See attached balance sheet and income statement below as
reference
Parent Company 2012 RO Consolidated 2012 Notes 2011 2011 RO...
Calculate the following ratios for 2012 and show the steps
involved:
a) Inventory turnover ratio
b) average days in inventory
c) receivables turnover ratio
d) average collection period
e) asset turnover ratio
f) profit margin on sales
g) return on assets
h) return on shareholders equity
i) equity multiplier
j) return on shareholders equity using the Du Port framework
Note: See attached balance sheet and income statement below as
reference
Parent Company 2012 RO Consolidated 2012 Notes 2011 2011 RO...
Hello, I need help answering these questions below for the Coke (KO) Company with the key...
 Hello,
I need help answering these questions below for the Coke (KO)
Company with the key ratios attached.
· How liquid is
the company?
· Is management
generating a substantial profit on the company's assets?
· If the
management of the company would like to improve the company's
financial performance, what should the management of THE COMPANY
do?
Also, what specific recommendation with supporting rationale
would you recommend. as to whether the assigned company's recent
trends and results in financial performance is of...
Hello,
I need help answering these questions below for the Coke (KO)
Company with the key ratios attached.
· How liquid is
the company?
· Is management
generating a substantial profit on the company's assets?
· If the
management of the company would like to improve the company's
financial performance, what should the management of THE COMPANY
do?
Also, what specific recommendation with supporting rationale
would you recommend. as to whether the assigned company's recent
trends and results in financial performance is of...
I need to match these ten industries using Exhibit 3: For example, Electrical Utility is #8 and Retail Grocery is #7. Pl...
 I need to match these ten industries using Exhibit 3: For
example, Electrical Utility is #8 and Retail Grocery is #7. Please
help! Thanks. I have 7 confirmed these are:
Each of the 10 publicly traded companies in Exhibit 3 is drawn
from one of the following industries (listed below in random
order):
I have 7 confirmed these are:
1. Management consulting services
2.
3. Data processing and camera
applications services
4. Electronic, aerospace, communication, sensor
systems
5. Hospital and...
I need to match these ten industries using Exhibit 3: For
example, Electrical Utility is #8 and Retail Grocery is #7. Please
help! Thanks. I have 7 confirmed these are:
Each of the 10 publicly traded companies in Exhibit 3 is drawn
from one of the following industries (listed below in random
order):
I have 7 confirmed these are:
1. Management consulting services
2.
3. Data processing and camera
applications services
4. Electronic, aerospace, communication, sensor
systems
5. Hospital and...
According to Case 06 Exhibit 6.1, what is Company P Operating Margin? Enter percentage, round to...
 According to Case 06 Exhibit 6.1, what is Company P Operating
Margin? Enter percentage, round to 2 decimal places.
Retail Airlines A B Beer C D Computers E F Hospitality G H Newspaper I J Pharmaceuticals K L Power M N Assets % O P 72 25 35 5 25 8 30 103 2 16 25 Cash & ST Investments Receivables Inventory Current Assets-Other Current Assets-Total Net Property. Plant, & Equipment Long-Term Marketable Securities Goodwill & Intangibles Assets-Other Assets-Total 6...
According to Case 06 Exhibit 6.1, what is Company P Operating
Margin? Enter percentage, round to 2 decimal places.
Retail Airlines A B Beer C D Computers E F Hospitality G H Newspaper I J Pharmaceuticals K L Power M N Assets % O P 72 25 35 5 25 8 30 103 2 16 25 Cash & ST Investments Receivables Inventory Current Assets-Other Current Assets-Total Net Property. Plant, & Equipment Long-Term Marketable Securities Goodwill & Intangibles Assets-Other Assets-Total 6...
 Current ratio Return on assets Return on equity Inventory turnover AR turnover Debt to equity Profit margin Gross profit 2012 RATIOS Coke Dr. Pepper 1.33 1.11 3.9% 7.9% 15.3% 27.6% 14.8 12.7 12.3 8.5 11 1.7% 10.6% 40.5% 58.3% The ratios for Coke and Dr. Pepper for 2012 are shown above. Which ratios show signs of poor financial health for DR PEPPER? Current ratio Return on Assets II Return on Equity Debt to Equity
 Complete Assurance of Learning Exercise 4C: Financial Ratio
Analysis for PepsiCo.
Financial Ratios for PepsiCo (2012) use the below information to
find
Liquidity Ratios:
- Current ratio:
- Quick ratio:
Leverage Ratios:
- Debt-to-total-assets ratio:
- Debt-to-equity ratio:
- Long-term debt-to-equity ratio:
- Times-earned-interest ratio: Profits before interest and
taxes/Total interest charges
Activity Ratios:
- Inventory turnover:
- Fixed assets turnover:
- Total assets turnover:
- Accounts receivable turnover:
Profitability Ratios:
- Gross profit margin:
- Operating profit margin:
-...
Complete Assurance of Learning Exercise 4C: Financial Ratio
Analysis for PepsiCo.
Financial Ratios for PepsiCo (2012) use the below information to
find
Liquidity Ratios:
- Current ratio:
- Quick ratio:
Leverage Ratios:
- Debt-to-total-assets ratio:
- Debt-to-equity ratio:
- Long-term debt-to-equity ratio:
- Times-earned-interest ratio: Profits before interest and
taxes/Total interest charges
Activity Ratios:
- Inventory turnover:
- Fixed assets turnover:
- Total assets turnover:
- Accounts receivable turnover:
Profitability Ratios:
- Gross profit margin:
- Operating profit margin:
-...
 6 Which financial leverage ratio is used with two other ratios to mathematically produce the return on equity ratio? Debt/ Equity Total Liabilities/(Equity - Intangible Assets) Total Assets/ Equity Total Liabilities/Equity 17 Which of the following is a tertiary ratio that drives profitability? SG&A Expense/Sales Net Profit/Sales EBIT /Sales EBIT /Net Profit 18 Which ratios indicate how efficiently the company is in generating sales from the company's assets? Net profit ratio Solvency ratio Quick asset ratio Working capital turnover 19...
 PA13-5 Interpreting Profitability, Liquidity, Solvency, and P/E Ratlos [LO4, L05] Coke and Pepsi are well-known international brands. Coca-Cola sells more than $35 billion worth of beverages each year while annual sales of Pepsi products exceed $43 billion. Compare the two companies as a potential investment based on the following ratios: Coca PepsiCo Cola Pepsico Ratio Gross profit percentage Net profit margin Return on equity EPS Receivables turnover ratio Inventory turnover ratio Current ratio Debt-to-assets P/E ratio 63.9% 33.6% 37.7% $5.06...
 Calculate the following ratios for 2012 and show the steps
involved:
a) Inventory turnover ratio
b) average days in inventory
c) receivables turnover ratio
d) average collection period
e) asset turnover ratio
f) profit margin on sales
g) return on assets
h) return on shareholders equity
i) equity multiplier
j) return on shareholders equity using the Du Port framework
Note: See attached balance sheet and income statement below as
reference
Parent Company 2012 RO Consolidated 2012 Notes 2011 2011 RO...
Calculate the following ratios for 2012 and show the steps
involved:
a) Inventory turnover ratio
b) average days in inventory
c) receivables turnover ratio
d) average collection period
e) asset turnover ratio
f) profit margin on sales
g) return on assets
h) return on shareholders equity
i) equity multiplier
j) return on shareholders equity using the Du Port framework
Note: See attached balance sheet and income statement below as
reference
Parent Company 2012 RO Consolidated 2012 Notes 2011 2011 RO...
 Hello,
I need help answering these questions below for the Coke (KO)
Company with the key ratios attached.
· How liquid is
the company?
· Is management
generating a substantial profit on the company's assets?
· If the
management of the company would like to improve the company's
financial performance, what should the management of THE COMPANY
do?
Also, what specific recommendation with supporting rationale
would you recommend. as to whether the assigned company's recent
trends and results in financial performance is of...
Hello,
I need help answering these questions below for the Coke (KO)
Company with the key ratios attached.
· How liquid is
the company?
· Is management
generating a substantial profit on the company's assets?
· If the
management of the company would like to improve the company's
financial performance, what should the management of THE COMPANY
do?
Also, what specific recommendation with supporting rationale
would you recommend. as to whether the assigned company's recent
trends and results in financial performance is of...
 I need to match these ten industries using Exhibit 3: For
example, Electrical Utility is #8 and Retail Grocery is #7. Please
help! Thanks. I have 7 confirmed these are:
Each of the 10 publicly traded companies in Exhibit 3 is drawn
from one of the following industries (listed below in random
order):
I have 7 confirmed these are:
1. Management consulting services
2.
3. Data processing and camera
applications services
4. Electronic, aerospace, communication, sensor
systems
5. Hospital and...
I need to match these ten industries using Exhibit 3: For
example, Electrical Utility is #8 and Retail Grocery is #7. Please
help! Thanks. I have 7 confirmed these are:
Each of the 10 publicly traded companies in Exhibit 3 is drawn
from one of the following industries (listed below in random
order):
I have 7 confirmed these are:
1. Management consulting services
2.
3. Data processing and camera
applications services
4. Electronic, aerospace, communication, sensor
systems
5. Hospital and...
 According to Case 06 Exhibit 6.1, what is Company P Operating
Margin? Enter percentage, round to 2 decimal places.
Retail Airlines A B Beer C D Computers E F Hospitality G H Newspaper I J Pharmaceuticals K L Power M N Assets % O P 72 25 35 5 25 8 30 103 2 16 25 Cash & ST Investments Receivables Inventory Current Assets-Other Current Assets-Total Net Property. Plant, & Equipment Long-Term Marketable Securities Goodwill & Intangibles Assets-Other Assets-Total 6...
According to Case 06 Exhibit 6.1, what is Company P Operating
Margin? Enter percentage, round to 2 decimal places.
Retail Airlines A B Beer C D Computers E F Hospitality G H Newspaper I J Pharmaceuticals K L Power M N Assets % O P 72 25 35 5 25 8 30 103 2 16 25 Cash & ST Investments Receivables Inventory Current Assets-Other Current Assets-Total Net Property. Plant, & Equipment Long-Term Marketable Securities Goodwill & Intangibles Assets-Other Assets-Total 6...
Most questions answered within 3 hours.
-
Industry: Telecommunications in India
Here, you need to discuss the sources of the growth pattern
and...
asked 41 minutes ago -
Hydrobromic acid
dissolves solid iron according to the followiaung reaction:
Fe(s)+2HBr(aq)→
FeBr2(aq)+ H2(g)
Part A. What...
asked 2 hours ago -
Verify the following vector identity in SPHERICAL
COORDINATES.
div(curl(A)) = 0
asked 4 hours ago -
The work function (Φ) for a metal is 7.50×10⁻¹⁹ J.
What is the longest wavelength (nm)...
asked 4 hours ago -
1. Would the following procedural changes cause the
calculated mass percent Ni2+ ion in Ni(NH3)nCl2 to...
asked 6 hours ago -
1. Why does the voltage of the capacitor vary with frequency?
where does this missing voltage...
asked 7 hours ago -
p p please write each step out clearly
3. A manager of a company is considering...
asked 6 hours ago -
On October 1, Ebony Ernst organized Ernst Consulting; on October
3, the owner contributed $83,540 in...
asked 7 hours ago -
A.)As an electron moves through a region of space, its speed
decreases from 9.60 × 10⁶...
asked 7 hours ago -
In java with the netbeans program do:
Through object programming
Create a class "ContadorP", which is...
asked 7 hours ago -
Pattern Corporation acquired all of Science
Company's outstanding stock on January 1, 2016 for $600,000 cash....
asked 7 hours ago -
Here are all accounts Tyler Co. maintains.
Tax expenses $4,750
Common stocks $48,840
SG&A expenses $2,500...
asked 8 hours ago